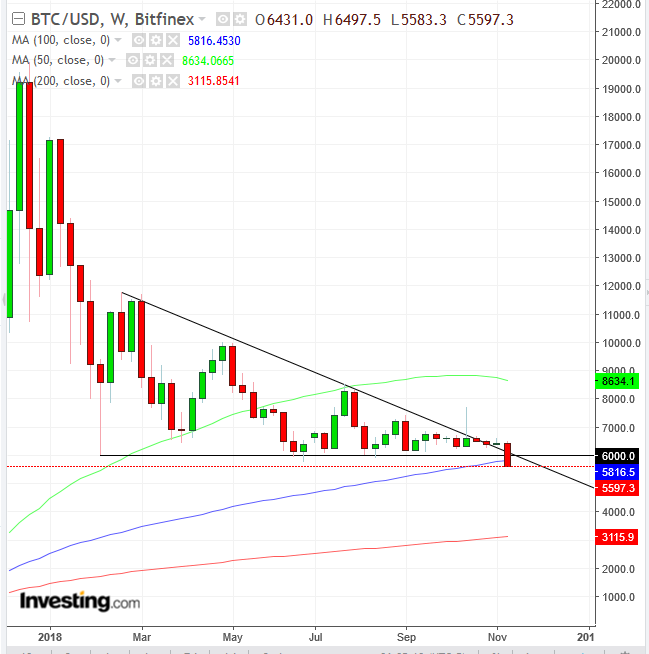
After months of relatively quiet range trading, Bitcoin is once again making headlines, but not in a good way. The digital currency dropped 2.5% so far today, slipping for the second day to a plunge of almost 11 percent in total.
The cryptocurrency market lost $15 billion in just 24 hours. Bitcoin's market cap itself fell below $100 billion for the first time since October 2017.
As of this writing the price continues to sink; currently it's $5,571.5, the lowest for the most popular cryptocurrency since October 2017. Bitcoin has been trading above $6,200 since July, but a Bitcoin Cash hard fork scheduled for today has stoked ongoing controversy among the asset class's enthusiasts, that appears to be adding pressure to the cryptosphere.

The supply-demand balance of Bitcoin formed a descending channel from the beginning of the year, below the $12,000 level and the $6,000 floor. The pattern is drawn in this shape, tracing supply outpacing demand, as sellers continuously reduce their offer price, while buyers aren't raising their bid price. The only level at which they were willing to buy has been each time Bitcoin fell to $6,000, the lowest level since October 2017.
According to basic economics, more supply than demand causes the price to fall, as sellers search out willing buyers at lower prices. Therefore, a descending triangle is innately bearish. The downside breakout—which included the 100 WMA—indicates that all the available demand within the pattern was absorbed and sellers had to further lower their offer price, to sell at "any price," a true sign of desperation.
It should be noted that we are using a weekly chart. The extraordinary volatility this asset has demonstrated in the past means we need to consider a wider scope. Also, in June, the price executed a false downside breakout of 3.5 percent on an intraday basis, about a 2.5 percent on a closing basis. Therefore, a close on a weekly basis will be more reliable.
Additionally, we have talked a lot about employing filters to avoid a bull and (as in this case) a bear trap. For standard assets we use a 3 percent filter for conservative traders, 2 percent filter for moderate traders and 1 percent filter for conservative traders.
However, because of the wild swings seen with cryptocurrencies we multiplied those filters by a factor of ten. In the past, when the value of Bitcoin was double and triple what it is currently, and trading volume and volatility were higher this filter worked appropriately.
Still, when an asset doesn't fit the mold—as is the case with cryptocurrencies—it should be clarified that any one gauge is unreliable. Therefore, use common sense. Consider the volatility and price action.
For example, yesterday's tumble was over 11 percent during trading, trimmed to about 9 percent by closing. That means that prices could easily move by multiple percentages in a single day. Exactly one month ago, on October 15, prices rose as much as 21 percent! Which means it can happen again.
Note that last month the unusual move was on a bullish attempt to break free of the bearish triangle, forming a false upside breakout.
Another way of avoiding a bear trap is by using a time filter, in addition to a price filter. Typical time filters are parallel to the price depth: three days, in which the price remains below the pattern, for conservatives; two days for moderates; one day for aggressive traders.
A third way to filter is to wait for a return move that verifies the integrity of the pattern, with a demonstration that sellers still overcome buyers, with at least one long, red candle following a green or small candle of any color.
Trading Strategies
Conservative traders should employ both a price depth filter, as well as a time filter, which would preferably include a weekend. Although Bitcoin trades seven days a week, a Friday close may still reflect investor commitment to some level, as many, especially institutions, don't trade over the weekend.
Trade Sample
- Entry: $5,500, after a successful return move that followed a penetration to the $4,200 level (30 percent filter) and return to the $6,000 level, where bears overcame bulls again. Conservative traders who are extra cautious may try their luck and patiently wait for another bullish attempt at the $,6000 level. The closer the entry to the $6,000 resistance, the lower the exposure.
- Stop-loss: $6,000, presumed resistance after a market reversal of support since February.
- Risk: $500
- Target: $3,000, round-psychological number and 200 WMA dual-support
- Reward: $2,500
- Risk-Reward Ratio: 1:5
Moderate traders would also use filters, as described above in the conservative section, though, per their risk level, they may be less stringent. For example, they could wait for a return move to limit exposure but not necessarily wait for the pattern to demonstrate resistance with another price drop. Of course, traders must choose their risk: entering immediately upon a return move, for lower exposure but increasing risk of a bear trap, or waiting for the second decline but increasing exposure.
Trade Sample:
- Entry: $5,550, after a successful return move, which followed a penetration to the $4,800 level (20 percent filter) and a return to the $6,000 level, where bears overcame bulls again. Depending on risk aversion, traders can enter a short position before waiting for a full return-move to the $6,000 level, in case that doesn't materialize.
- Stop-loss: $6,000, pattern resistance
- Risk: $500
- Target: $3,000
- Reward: $2,500
- Risk-Reward Ratio: 1:5
Aggressive traders may enter upon employing time as well as price filters that suit their risk level per the description above, as well as in the sections for conservative and moderate traders.
- Entry: $5400, upon a 10-percent penetration at a closing basis. It’s up to the trader to decide to enter immediately or wait for a return-move for lower exposure.
- Stop-loss: $5,500, round-psychological number
- Risk: $100
- Target: $4,500
- Reward: $1,000
- Risk-Reward Ratio: 1:10
