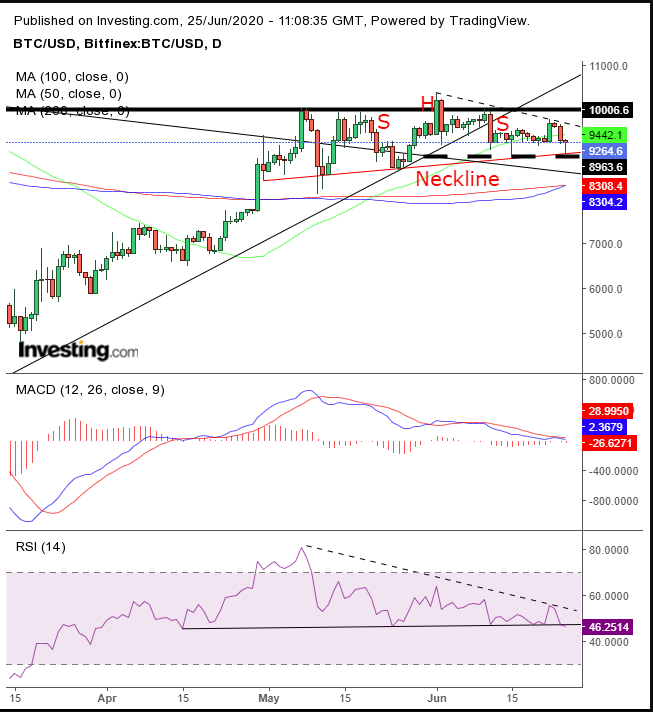
Bitcoin is down for the third straight day, although it has recovered from today's earlier lows to trade near its opening price.
The impetus behind the move was the upcoming $1 billion expiry of Bitcoin options, the largest on record, and the panic over a possible second wave of coronavirus that swept over the broader market, forcing a sell-off in gold, as well as the cryptocurrency itself, sometimes referred to as digital gold.
However, we also recognize some technical drivers are at work.

The largest cryptocurrency by market capitalization, Bitcoin has been repeatedly turned away from the psychological, round-figure $10,000 level—not just since it rallied to that point on May 7, but on every occasion since it fell below this mark back in September 2019.
After failing to make new highs for over a month and a half, it looks like the bulls are getting tired, if not losing faith.
After finishing above $10,000 on June 1—the first close above this level since Feb. 18, before the COVID-19 selloff—Bitcoin wiped out those gains the very next day. Since that close on June 1, it has been overwhelmed by selling at lower levels on both of the occasions it has attempted to take on this milestone.
The price closed below the 50 DMA on June 19, for the first time since Feb. 26, from which point it plunged by about 55% before rebounding from the lows in mid-March. Some traders might find that significant and reposition accordingly.
Today’s sharp rebound may appear bullish, and the individual hammer candlestick formation is inherently bullish, but the fact that it found support so obviously on our interpretive neckline—which traces most lows since Apr. 30—only convinces us further of the significance of this trend line. If this trend line breaks, it would likely have an impact on the supply-demand balance of Bitcoin, as it completes a H&S top.
Note: the price also found support today at the exact point where the uptrend line from the March low meets with the downtrend line since the June 2019 high.
Both the MACD and the RSI have been providing negative divergences throughout the H&S top development. The RSI also looks about to complete its own H&S top, which—as a momentum-based indicator—preceded the move in the price.
Trading Strategies
Conservative traders should wait for a bonafide completion of the H&S top, with a downside breakout and employ a filter to avoid an unpleasant bear trap. We would normally advise on assuming a minimum penetration of 3%, but considering the volatility of Bitcoin, we recommend allowing for at least a 10% drop, which would also clear the lowest price level within the pattern development, which is the May 10 low. Then, wait for a corrective rally to retest the pattern integrity before risking a short position.
Moderate traders would do well to include a 5% penetration, to limit the odds of a bear trap, which would take them below the lowest close of the pattern posted on Apr. 30. They, too, could wait for a short squeeze that would cause the price to temporarily rebound, but only as a means of providing a better point of entry, not necessarily for confirming the trend.
Aggressive traders may short Bitcoin, either if it climbs to $9,600, or with a downside breakout below $8,800, with at least a 1% filter, below the June 15 low, the point at which the two trend lines mentioned above, cross.
Trade Sample
- Entry: 8,800
- Stop-Loss: 9,300 – above the June congestion
- Risk: $500
- Target: 7,300
- Reward: $1,500
- Risk:Reward Ratio: 1:3
Note: This is only a trade sample to know what primary components to include into your trade plan. It is important for you to develop a trade plan tailored to your personal needs and temperament.
