Oil prices are down for a third day, as some of the commodity's major fundamental catalysts appear to have gone to ground. While shale superpower, the United States, has been decimated by the same pandemic that has squashed demand for crude worldwide, OPEC+ is being torn apart by the divergent interests}} of its members.
The conflict, which revolves around whether production cuts should remain in place for a few additional months because of global economic fragility, has not been resolved, causing the cartel to delay its official meeting this week by two days, until Thursday.
Today’s factory activity releases in Asia are underscoring the uneven recovery that's occurring worldwide with more robust data in that region than in Europe or the US—auguring mixed demand. The outlook for escalating demand pushed oil prices to their biggest monthly gains since May.
But anticipation of an uneven recovery is reflected in the disparate market positions taken by the 9-month high bullish wagers of money managers versus the 470 million bearish short positions in Brent futures reported yesterday by {{0|ICE Futures Europe, their biggest short position ever.
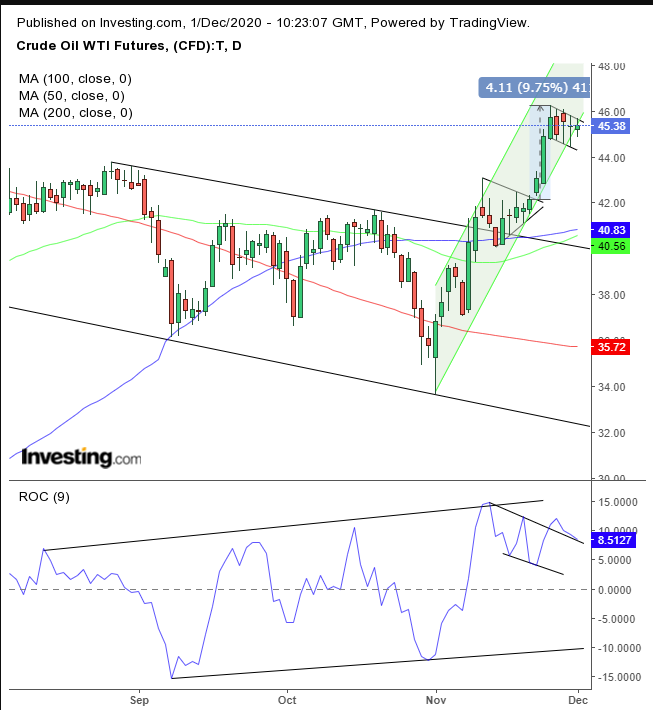
This dissonance is reflected in WTI's technical chart:

The biggest monthly gains in oil since May provided an upside breakout to a falling channel in place since the August highs. It received help from a continuation pennant, whose upside breakout has been forming a falling flag, bullish after the 9.75 pennant breakout.
The falling nature of the pattern demonstrates the increase in supply following the commodity's dramatic gains in just three days, while the tightness of the pattern proves demand is sufficient to absorb it. An upside breakout will be the final proof required to show that the supply-demand balance has tipped in favor of demand as buyers raise their bids to seek more available supply, at higher prices, setting off a chain reaction for continued rallies.
Note, the flag is complete only with an upside breakout, though the Rate of Change (ROC) suggests one is likely to occur, with its own upside breakout to the current range, after having provided a positive divergence to the falling channel.
Trading Strategies
Conservative traders would wait for the upside breakout of at least one, long green candle, followed by a return move that would put demand to the test above the flag.
Moderate traders would want to see a pull-back as well, but for a better entry if not for proof it will hold.
Aggressive traders may enter a long position at will, provided they have written a trade plan that accounts for risk in acceptable proportion to their expected reward.
Here’s an example:
Trade Sample
- Entry: $45
- Stop-Loss: $44
- Risk: $1
- Target: $54
- Reward: $9
- Risk:Reward Ratio: 1:9
