Alcoa (NYSE:AA) is due to report Q1 2019 corporate results today, after market close. Analysts expect the world's eighth largest aluminum producer to show an EPS of -$0.12 on $2.82 billion in revenue.
So far, the Pittsburgh-based aluminum miner and producer has beaten on EPS expectations for four quarters straight and on revenue for the past three quarters. For the same period last year Alcoa came in at $0.77 EPS rather than the expected $0.68, on revenues of $3.09 billion vs the consensus estimate of $3.1 billion.
The situation, however, might be very different later today given the company's dismal performance this year. Shares of Alcoa are down 2.14% since the start of the year compared to the S&P 500's 15.96% jump over the same period. Though we remain bearish on the major index, we believe things look even grimmer for Alcoa based on how its primary product, aluminum, has been trading.

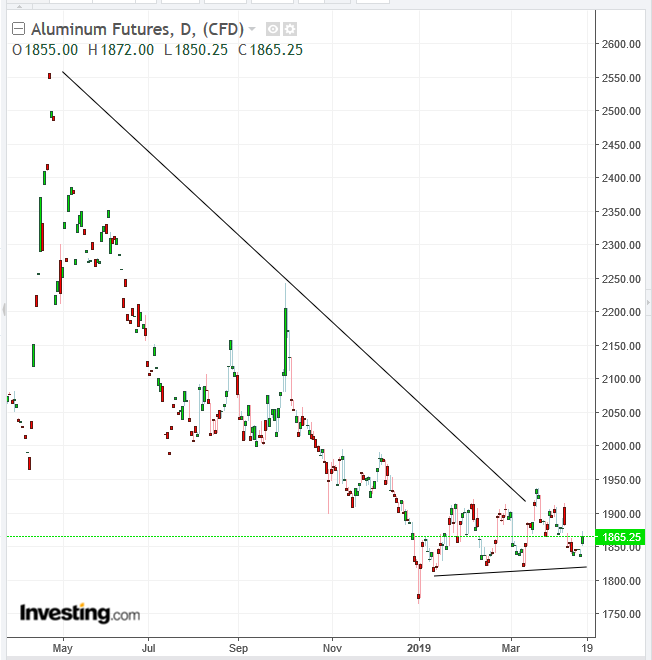
Note the sideways move for the commodity since the beginning of the year, after falling since April of last year. And why is aluminum falling so drastically? Possibly because it's a leading indicator for a global economic slowdown.
Now compare that to Alcoa's stock chart.

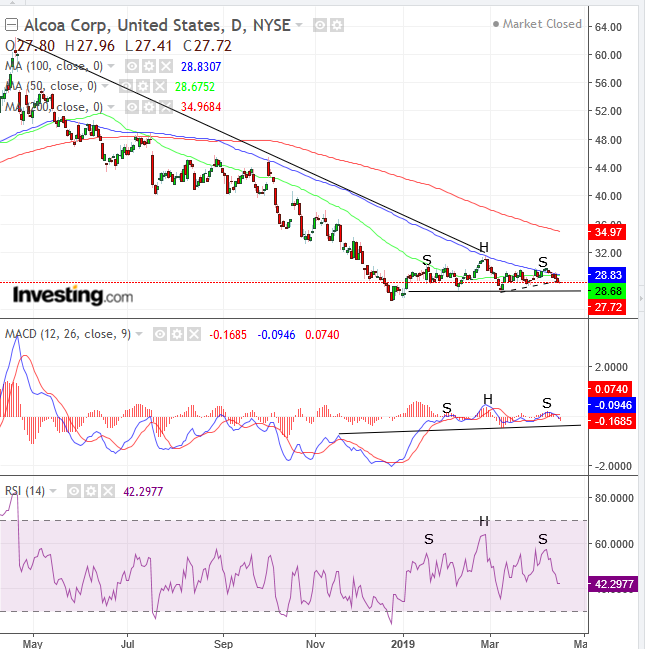
Note the similar moves.
While most traders may have a passing knowledge of a H&S reversal, in this chart we're actually looking at a H&S continuation pattern, something that's much rarer. While a reversal H&S is the visual representation of a slowing trend, increasing in the direction of its origin, the continuation pattern demonstrates an attempt—but ultimate failure—of a reversal, and a continuation of the almost-prior trend.
The price bounced in January from its December low, making it a presumable bottom. That was followed by a low higher than the one in January, signaling the potential first half of an upward trend, a hopeful first-of-two ascending peaks and troughs.
The February peak bested the January’s high, pushing aggressive bulls to increase their positions. However, something then happened that shouldn’t have.
In March, the price dipped below the February-trough, failing the minimum formation of an uptrend, letting down technical-minded bulls. If that wasn’t enough, the April low ebbed out below February’s nadir, sealing this trading range as trendless. At the same time, the price failed to scale above the 100 DMA and fell back below the 50 DMA.
Could it be time for bulls to begin diluting holdings? Note that both the MACD and RSI provide a unanimous picture confirming this is likely the case.
A downside breakout of the neckline, connecting the lows throughout the congestion, at $26.51, would demonstrate that all demand has been absorbed and sellers are willing to lower their offering prices to find more willing buyers.
As well, a note of caution: the Dec. 24 low was $25.08, the lowest level since Nov. 2016, before the Trump election victory propelled the market to another rally within the bull market. This was just atop the $25 round-psychological level. This level may prove a support.
Trading Strategies – Short Position Setup
Conservative traders should wait for the price to clear the $25 levels.
Moderate traders should wait for a downside breakout, with at least a 2% filter below $25.95, to decrease the odds of a bear trap. Then, wait for a return move for a better entry, but not necessarily for proof of trend.
Aggressive traders may enter a short now, expecting Alcoa’s earnings to reflect the shrinking demand seen in the underlying commodity, amid a potential economic contraction. Technically, the price fell below the uptrend line since March 8.
Trade Sample
- Entry: $28
- Stop-Loss: $30, round-psychological number, providing the right shoulder’s resistance
- Risk: $2
- Target: $22
- Reward: $8
- Risk-Reward Ratio: 1:3
