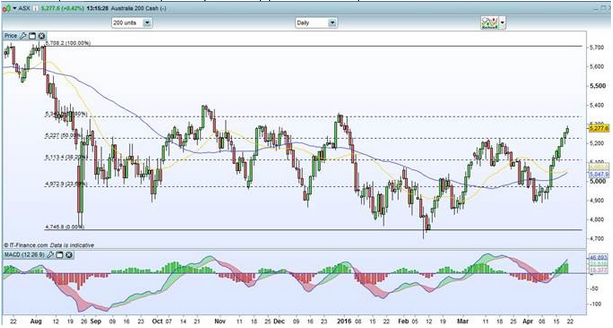
The ASX has had an incredible performance in April, gaining 5.6%. But many in the market are expecting a reversal, and so the question is what levels do we need to see the ASX break through before we can definitively say this rally has legs.
The ASX managed to close above 5200 for the first time since 4 January on Wednesday. There still looks to be plenty of momentum behind its current uptrend, the MACD oscillator is far off indicating a reversal. A close above 5300 would bring the index close to the 61.8% Fibonacci retracement line from where the index sold off at the start of August. But the level everyone in the market is watching carefully is 5352, which is where the ASX closed on 23 October and was its highest close since the early-August selloff. Of course, should the ASX be rejected at any of these key levels that could signal we are in for a sharp decline and may be a good entry point for short positions.
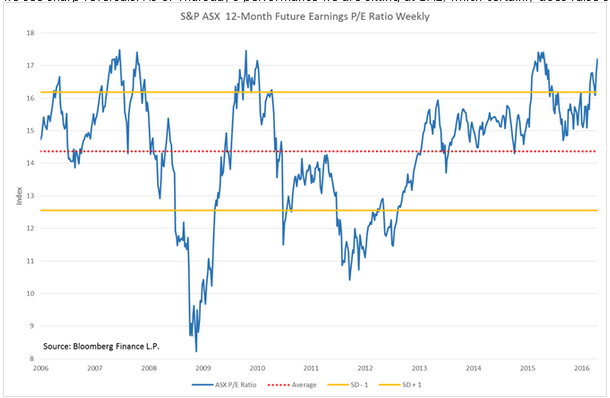
On the price to forward earnings expectations valuation, the ASX is still looking quite overvalued despite the selloff we have seen. Currently, the forward P/E is sitting almost 1.5 standard deviations above the long-term average. Based on the past ten years, it is usually when the forward P/E ratio is above 17 that we see sharp reversals. As of Thursday’s performance we are sitting at 17.2, which certainly does raise some red flags.
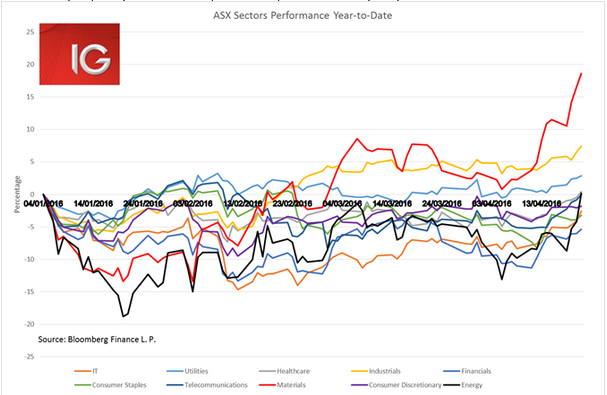
The big increase in stimulus spending and investment activity in China in 1Q has had a major impact on the ASX. The materials sector is the best performer in the index, gaining 18.6% year-to-date. The current global equity rally in April has been drive by TIME stocks, namely tech, industrials, materials and energy. This has certainly been true for the ASX, although for it to break out to the highest levels seen since early-August it is going to need the banks to start finding buyers given their heavy market capitalisation weighting.
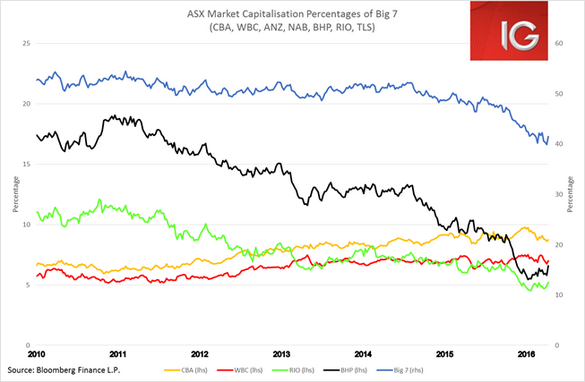
At 28.2% of the total market capitalisation of the ASX, banks still make up a very weighty part of the market. When one takes the whole financials sector that makes up 45%. Clearly, for the ASX to start moving steadily above the 5350 level investor appetite in the financials space is going to need to increase dramatically. Much of the recent move has been driven by the materials space, which has seen its market cap weighting shrink to 15% from its highs of 29% in 2012.
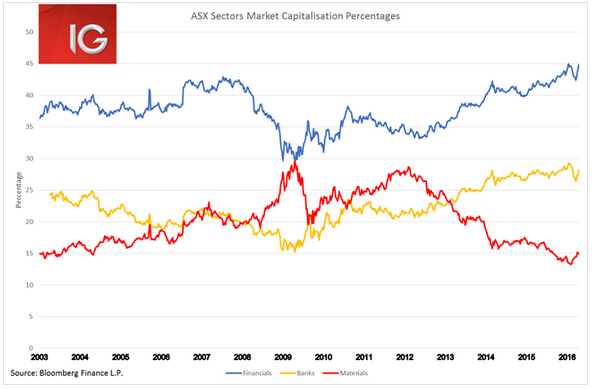
Until last year’s August sell off, the biggest 7 stocks in the ASX still cumulatively accounted for 50% of the market. The Big 7 include the Big Four banks (CBA, WBC, ANZ, NAB), the two big miners (BHP, RIO) and Telstra. While their weight in the index has shrunk to 42%, largely driven by the declines in BHP and RIO, they will still be the key drivers behind any moves in the index above 5350.
