It’s been a fairly active morning on the desk, with traders giving Netflix (NASDAQ:NFLX) and Yahoo (NASDAQ:YHOO) somewhat of a working over. Certainly Netflix initially saw good selling activity after the sizeable miss to overseas customers and overall subscriber growth, however at the time of writing we are seeing more aggressive traders looking to buy with the stock down 15% in the after-hours.
Earnings in the coming session will largely center on Goldman Sachs (NYSE:GS) and Johnson & Johnson (NYSE:JNJ), with GS having had rallied some 18% since 27 June amid a rally in the broader financial sector, so they will need to come out with some good numbers here.
At an index level, the S&P 500 still looks bullish on the daily chart given the underlying trend, but if we focus on price action alone there is certainly some indecision creeping in and I wouldn’t be surprised to see a slight move back into the 2140 to 2135 area. Taking the timeframe in a touch to the four-hour chart, it seems the index is happy to trade in a sideways consolidation pattern.
We will need to see good earnings, or the market is at risk of rolling over into my suspected target given the lack of any tier-one economic data to focus on this week.
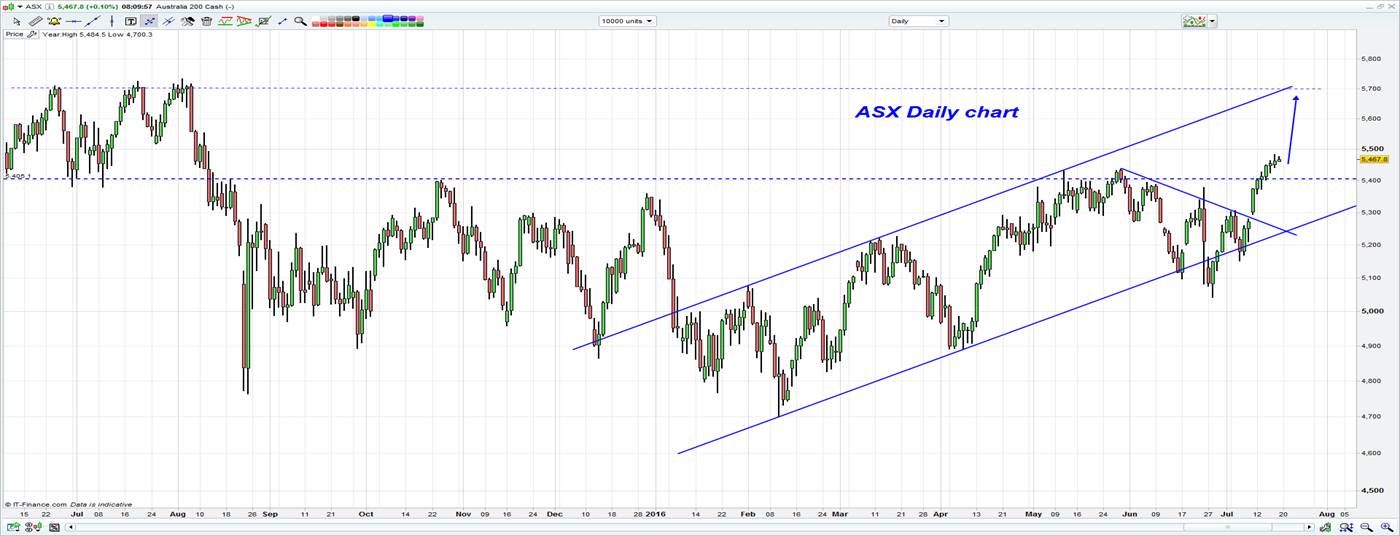
The moves in US markets have set the ASX 200 up for an interesting open, with our call for 5470 (+12 points). I was clearly incorrect last week when I felt the risk reward was against buying when the market had rallied for five consecutive days, but I certainly wasn’t advocating shorting the market.
This remains the case, as the technical set-up on the market is undoubtedly bullish on either the daily or weekly chart (see below). In fact, I see real scope that we could see 5700 as a longer-term target and a re-test of the mid-2015 and rising channel highs.
However, with the market staring at a ninth straight day of gains, the risk is that we do see a few participation offloading stocks, but on current sentiment it seems likely that any pullbacks will be shallow and a buying opportunity.

Another issue has been volume, and if we focus on the $3.86 billion volume through the ASX 200 yesterday this was well below the year’s average of $5.8 billion and 33% below the 30-day average. Breadth has been good though and participation in the rally has been strong, but the pathetic volume going through the market is a concern and highlights some fatigue in the move.
There seems little to drive today, but traders will likely keep one eye on the RBA minutes at 11:30 AEST and the CNY ‘fixing’ at 11:15 AEST. From a trading perspective the AUD/USD is in a really comfortable spot and happy to trade in a tight range of $0.7600 to $0.7580, so a break either side could set off a new short-term trading bias.
I also think another move from the PBoC today to weaken the Chinese yuan could start having a bigger impact on the market. With USD/JPY moving through ¥106.00 there is a chance we see the PBoC fix the CNY at the weakest level since October 2010.
