It was the last thing even the most ardent oil bull expected, so when the 10 million-barrel draw was announced by the U.S. Energy Information Administration in the place of the 2 million forecast by analysts, it understandably knocked the daylights out of most short-sellers in the market.
Humongous crude draws are common during mid-cycle of the summer driving season. Since this one came toward the end—the week ended Aug. 23 —it naturally spawned questions on what it could have been driven by, particularly when the current narrative across the market is of weak demand from fears about the U.S.-China trade war and a potential global recession.
Within that 10 million-barrel drop, imports of crude fell by more than one million barrels to beneath the typical 6 million, validating the slowdown theory. Still, the gasoline and distillates draw of 2 millions each and strong exports above 3 millions jarred with the market narrative. Some wondered if refiners had gone on a kind of crazy production streak to forerun Hurricane Dorian, over fears that it could turn toward energy platforms on the U.S. Gulf Coast instead of just Florida, where it ended up.
Will The Coming Draw Be Satisfactory?
Whatever the case, all that is literally water under the bridge now. What matters at the moment is whether the EIA will announce another draw this week—for the week ended Aug. 30. That's what analysts expect, given that it would have been the last hurrah for U.S. drivers, culminating in the weekend before Monday’s Labor Day holiday. If it’s a draw, will it measure up in some way to the last one, or at least be “decent”—meaning a couple of million barrels or more, as forecasted?
Crude draws typically thin out from the start of September. But there is a possibility for them to remain strong for a while. For instance, in the penultimate week of August 2018, the EIA reported a crude drawdown of 5.8 million barrels. In the following four weeks, U.S. stockpiles continued to see declines, losing a cumulative 14.2 million barrels.
In 2017, U.S. crude draws abruptly stopped in the final week of August before three straight weeks of builds that added nearly 15 million barrels to inventories. But almost all of that was cleared in the successive four weeks, as stockpiles dropped without a pause.
More Importantly, Will Any Rally From The Crude Draw Last?
But perhaps the more important question that should be asked is: What help really will another big draw bring for crude prices?
If the price action since the last EIA data release is any guide, the answer is “very little."


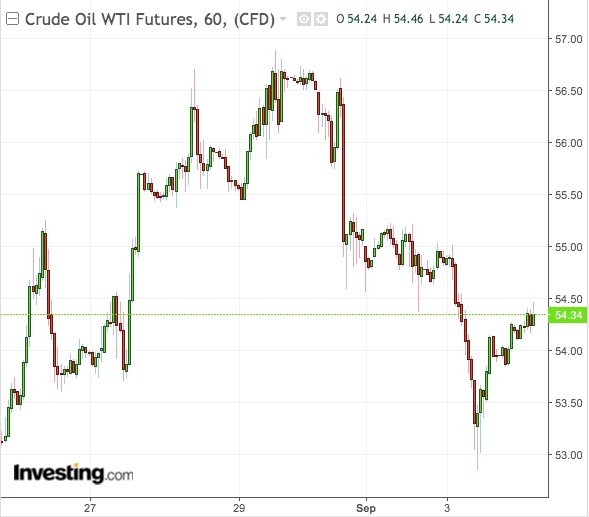
U.S. West Texas Intermediate crude settled down about 1% at $53.64 per barrel on Aug. 26, a day before the American Petroleum Institute alerted traders to the possibility of the EIA announcing a draw as big as 11 million barrels.
After the API bulletin and the EIA’s confirmation of most of that number, WTI rose about 2% on each of the three following days. Then, with the weekend looming, it plunged almost 3% as China surprised the Trump administration with retaliatory tariffs after those imposed earlier by the U.S.. Crude prices continued to slide on Monday and Tuesday on recession worries.
At Tuesday’s settlement, and ahead of the API’s next bulletin, WTI stood at $53.84—just 20 cents higher from a week ago.
What this proves is that the trade war and recession are the twin factors lording over the market—and even the biggest U.S. draw number might just get swept away in the sea of bearish sentiment pervading crude.
And it’s not just demand worries that are sapping at oil prices.
OPEC, Russia, Aren’t Helping Market Either
Overproduction by OPEC, as well as non-adherence by Russia to output cuts it promised the cartel, have worsened sentiment.
A Reuters survey last week showed that OPEC oil output increased in August for the first time in 2019. The oil-producer group pumped 29.61 million bpd last month, an increase of 80,000 bpd from July.
Russian Oil Minister Alexander Novak, on his part, admitted on Friday that Moscow wasn’t honoring the production cuts it had agreed to, bringing last week’s rally in crude to a screeching halt.
If, for any reason, WTI and global crude benchmark Brent fall beneath $50 per barrel, it would be safe to assume that Saudi Arabia and the combined forces in OPEC will do anything to “rebalance” the market, as the Kingdom hinted a couple of weeks back. Notwithstanding its August slip, the cartel has vowed to keep 1.2 million barrels per day off the market, though Saudi Arabia itself has often done more.
While crude could rally on the back of even stronger Saudi cuts, the likelihood is that the trade war and recession fears will hold greater sway over the market. What we might get is more of the market swings that have helped volatility traders in recent weeks.
