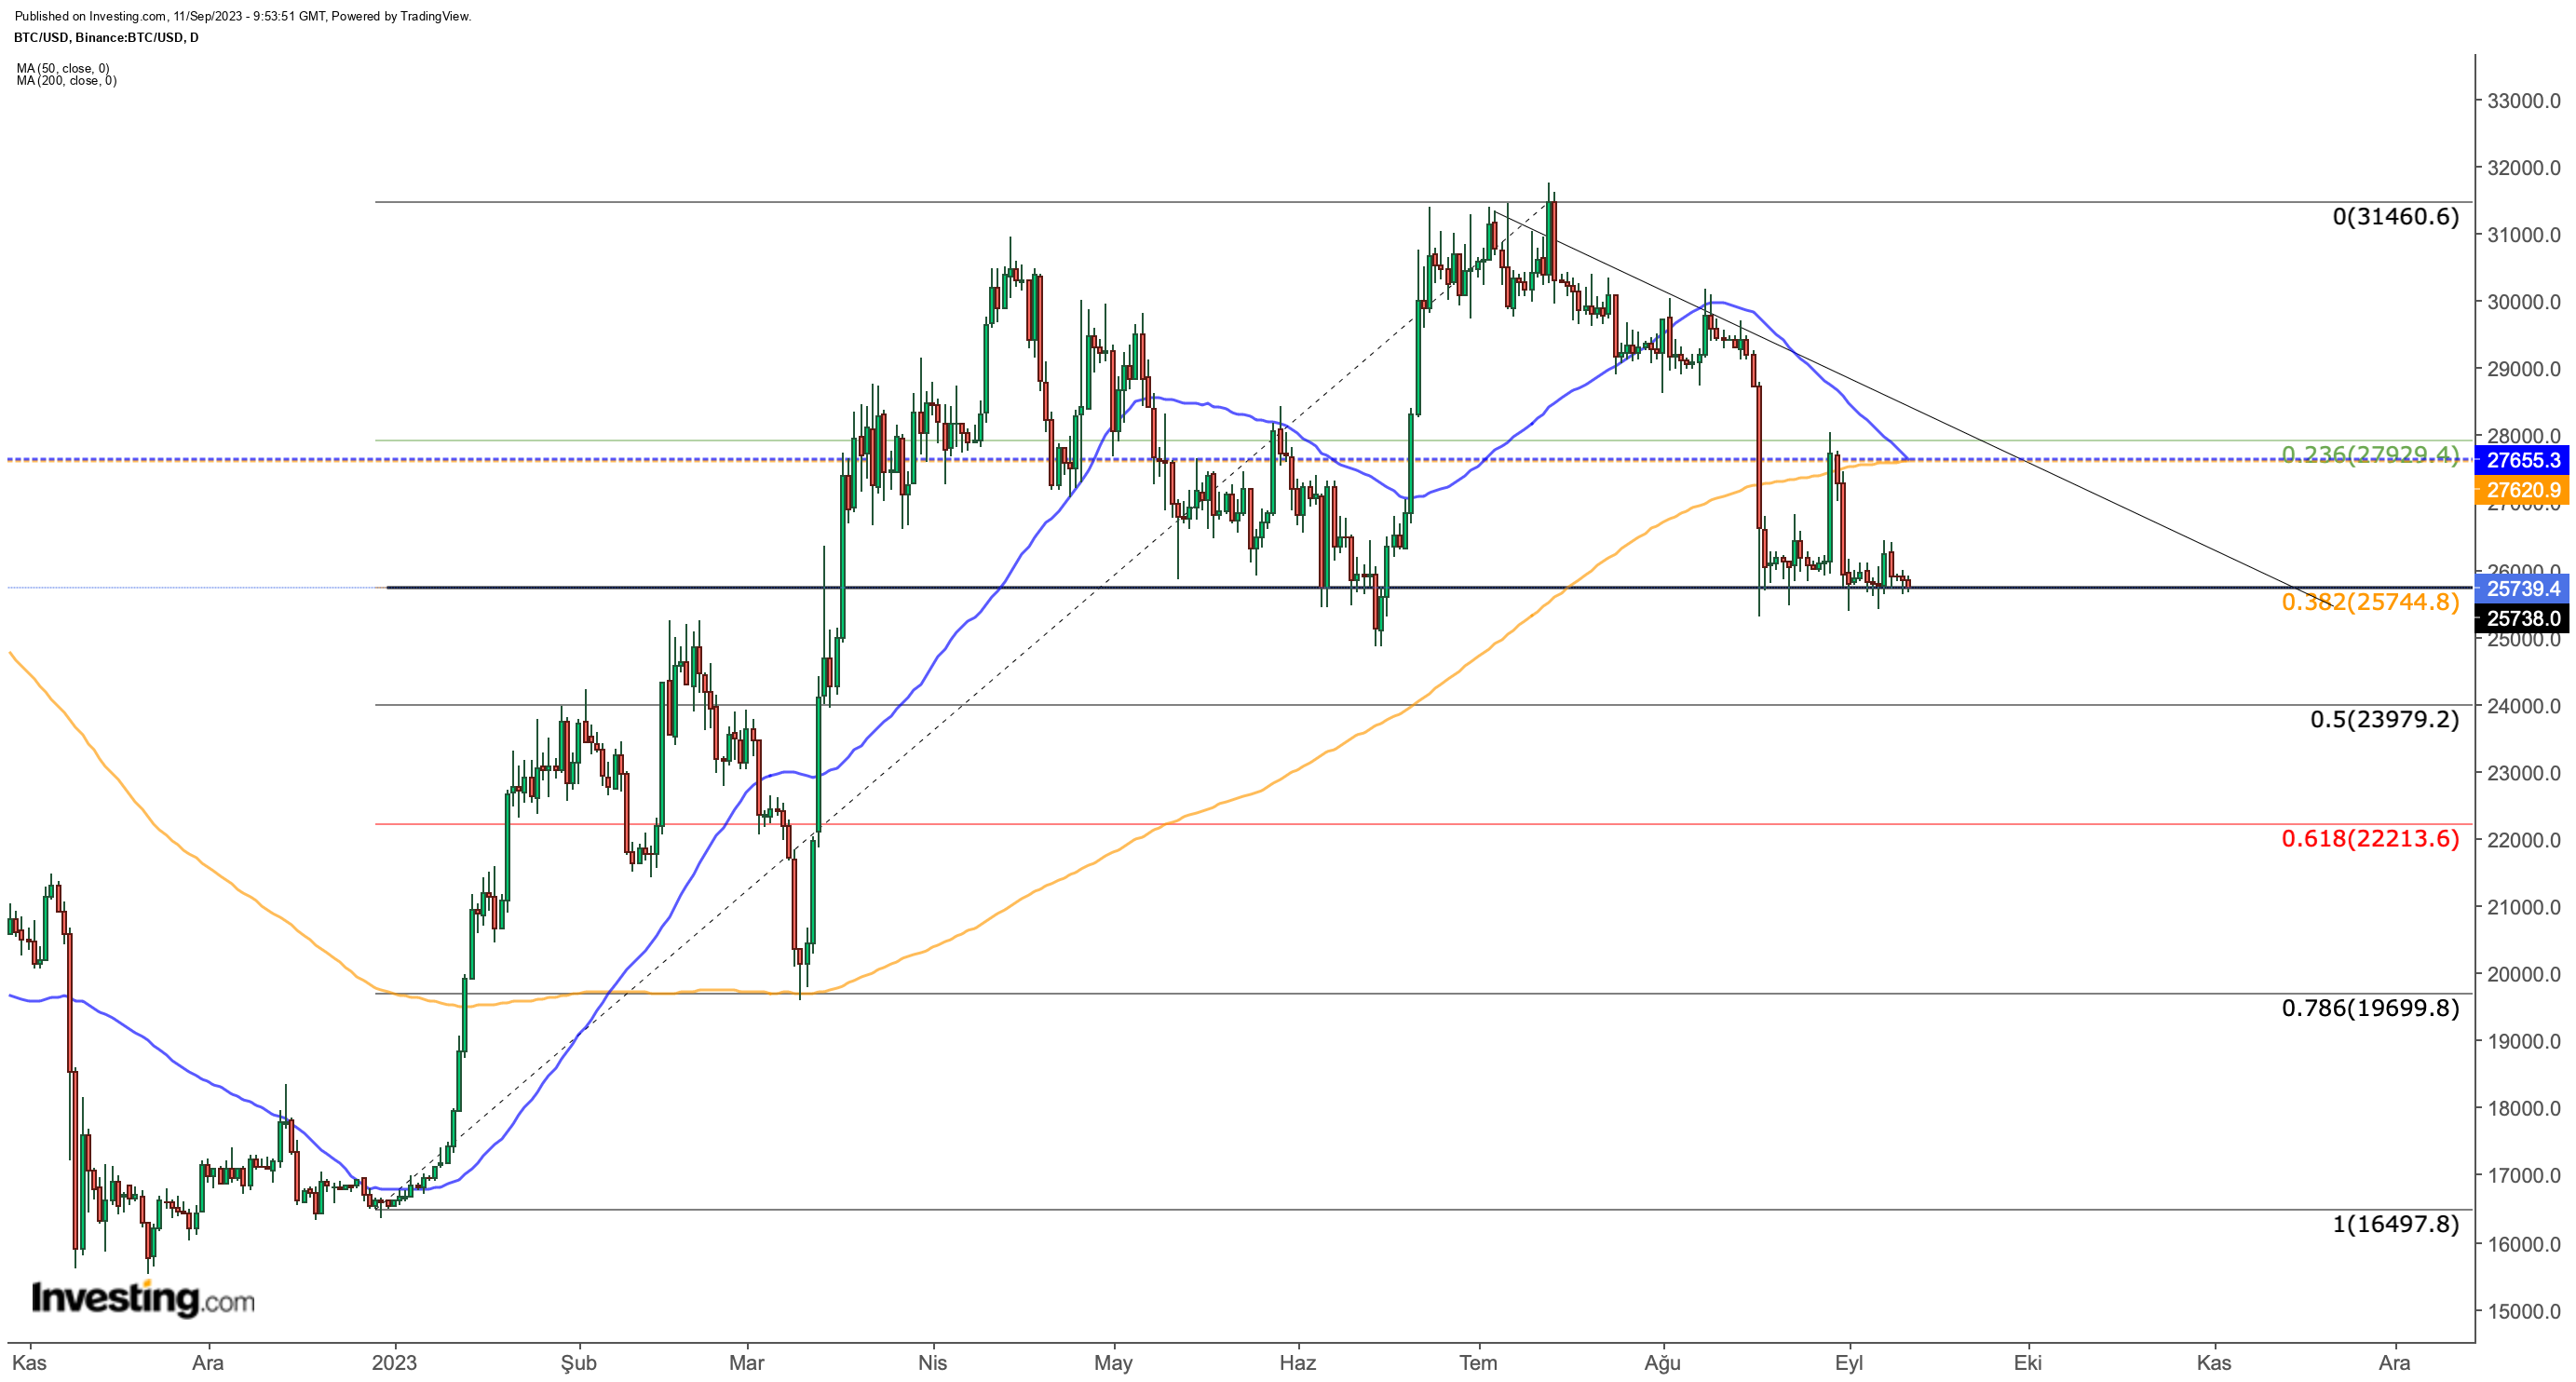
- Bitcoin's 50-day MA has crossed below 200-day MA, forming a 'death cross'
- Technically, this often indicates significant declines could be in the offing
- This formation also comes at a time when global headwinds aren't favoring the crypto
This week holds significant importance for Bitcoin, with both global developments and technical aspects coming into play.
On the global front, key events include US inflation data and the ECB's interest rate decision. The US CPI data is closely watched for insights into the Fed's interest rate decisions, while the ECB's decision influences global fund flows.
These events could significantly impact the crypto markets, which are also dealing with negative factors such as FTX's asset sales and rumors of Coinbase (NASDAQ:COIN)'s exit from the Indian market.
The cryptocurrency markets have been waiting for the possible approval of a Spot Bitcoin ETF as a positive catalyst during the summer. However, the SEC's delays have dampened institutional fund appetite, keeping the markets subdued.
Factors like uncertainty in global markets and China's slowing growth have also reduced investor demand for risky assets. Bitcoin has been holding onto a critical support zone since its August 17 drop, but the current outlook suggests a breakout is becoming more likely this week.
Bitcoin: Technical View
From a technical perspective, the daily Bitcoin chart reveals the intersection of the 50-day moving average with the 200-day moving average. This crossover, often referred to as a 'death cross,' suggests further declines are likely.

If Bitcoin sees daily closures below $25,500, which has been a sustained level, it could confirm the death cross and open the door to a deeper decline. This would also mean losing the critical support that worked in June.
In the event of a bearish acceleration, Bitcoin's price could potentially retreat to the $22,200 (Fib 0.618) region in the short term, with intermediate support around $24,000.
Historically, after a possible decline, Bitcoin may test the 200-day moving average, currently at $27,620, with buying reactions expected around the $22,000 level.
A rebound to the 200 MA after a decline would be significant. If buyers can push BTC above the 200 MA, it could shift the negative outlook and usher in an uptrend.
However, as long as BTC remains below the 200 MA, it may break its crucial support at $22,000 and head towards the $15,000 region.
In summary, the current outlook suggests that Bitcoin may experience a short-term decline followed by a potential recovery.
The reaction at the 200 MA level will be vital in determining Bitcoin's new direction. On the other hand, if buying pressure strengthens, Bitcoin could aim for levels above $28,000, closely watched for a sustainable breakout.
***
Disclosure: The author holds no position in any of the instruments mentioned in this report.

