- Bitcoin, Ethereum are both in a downtrend
- Ahead of crucial inflation data, both cryptos are trading within key support levels
- The data release is set to cause volatility to spike for the cryptos
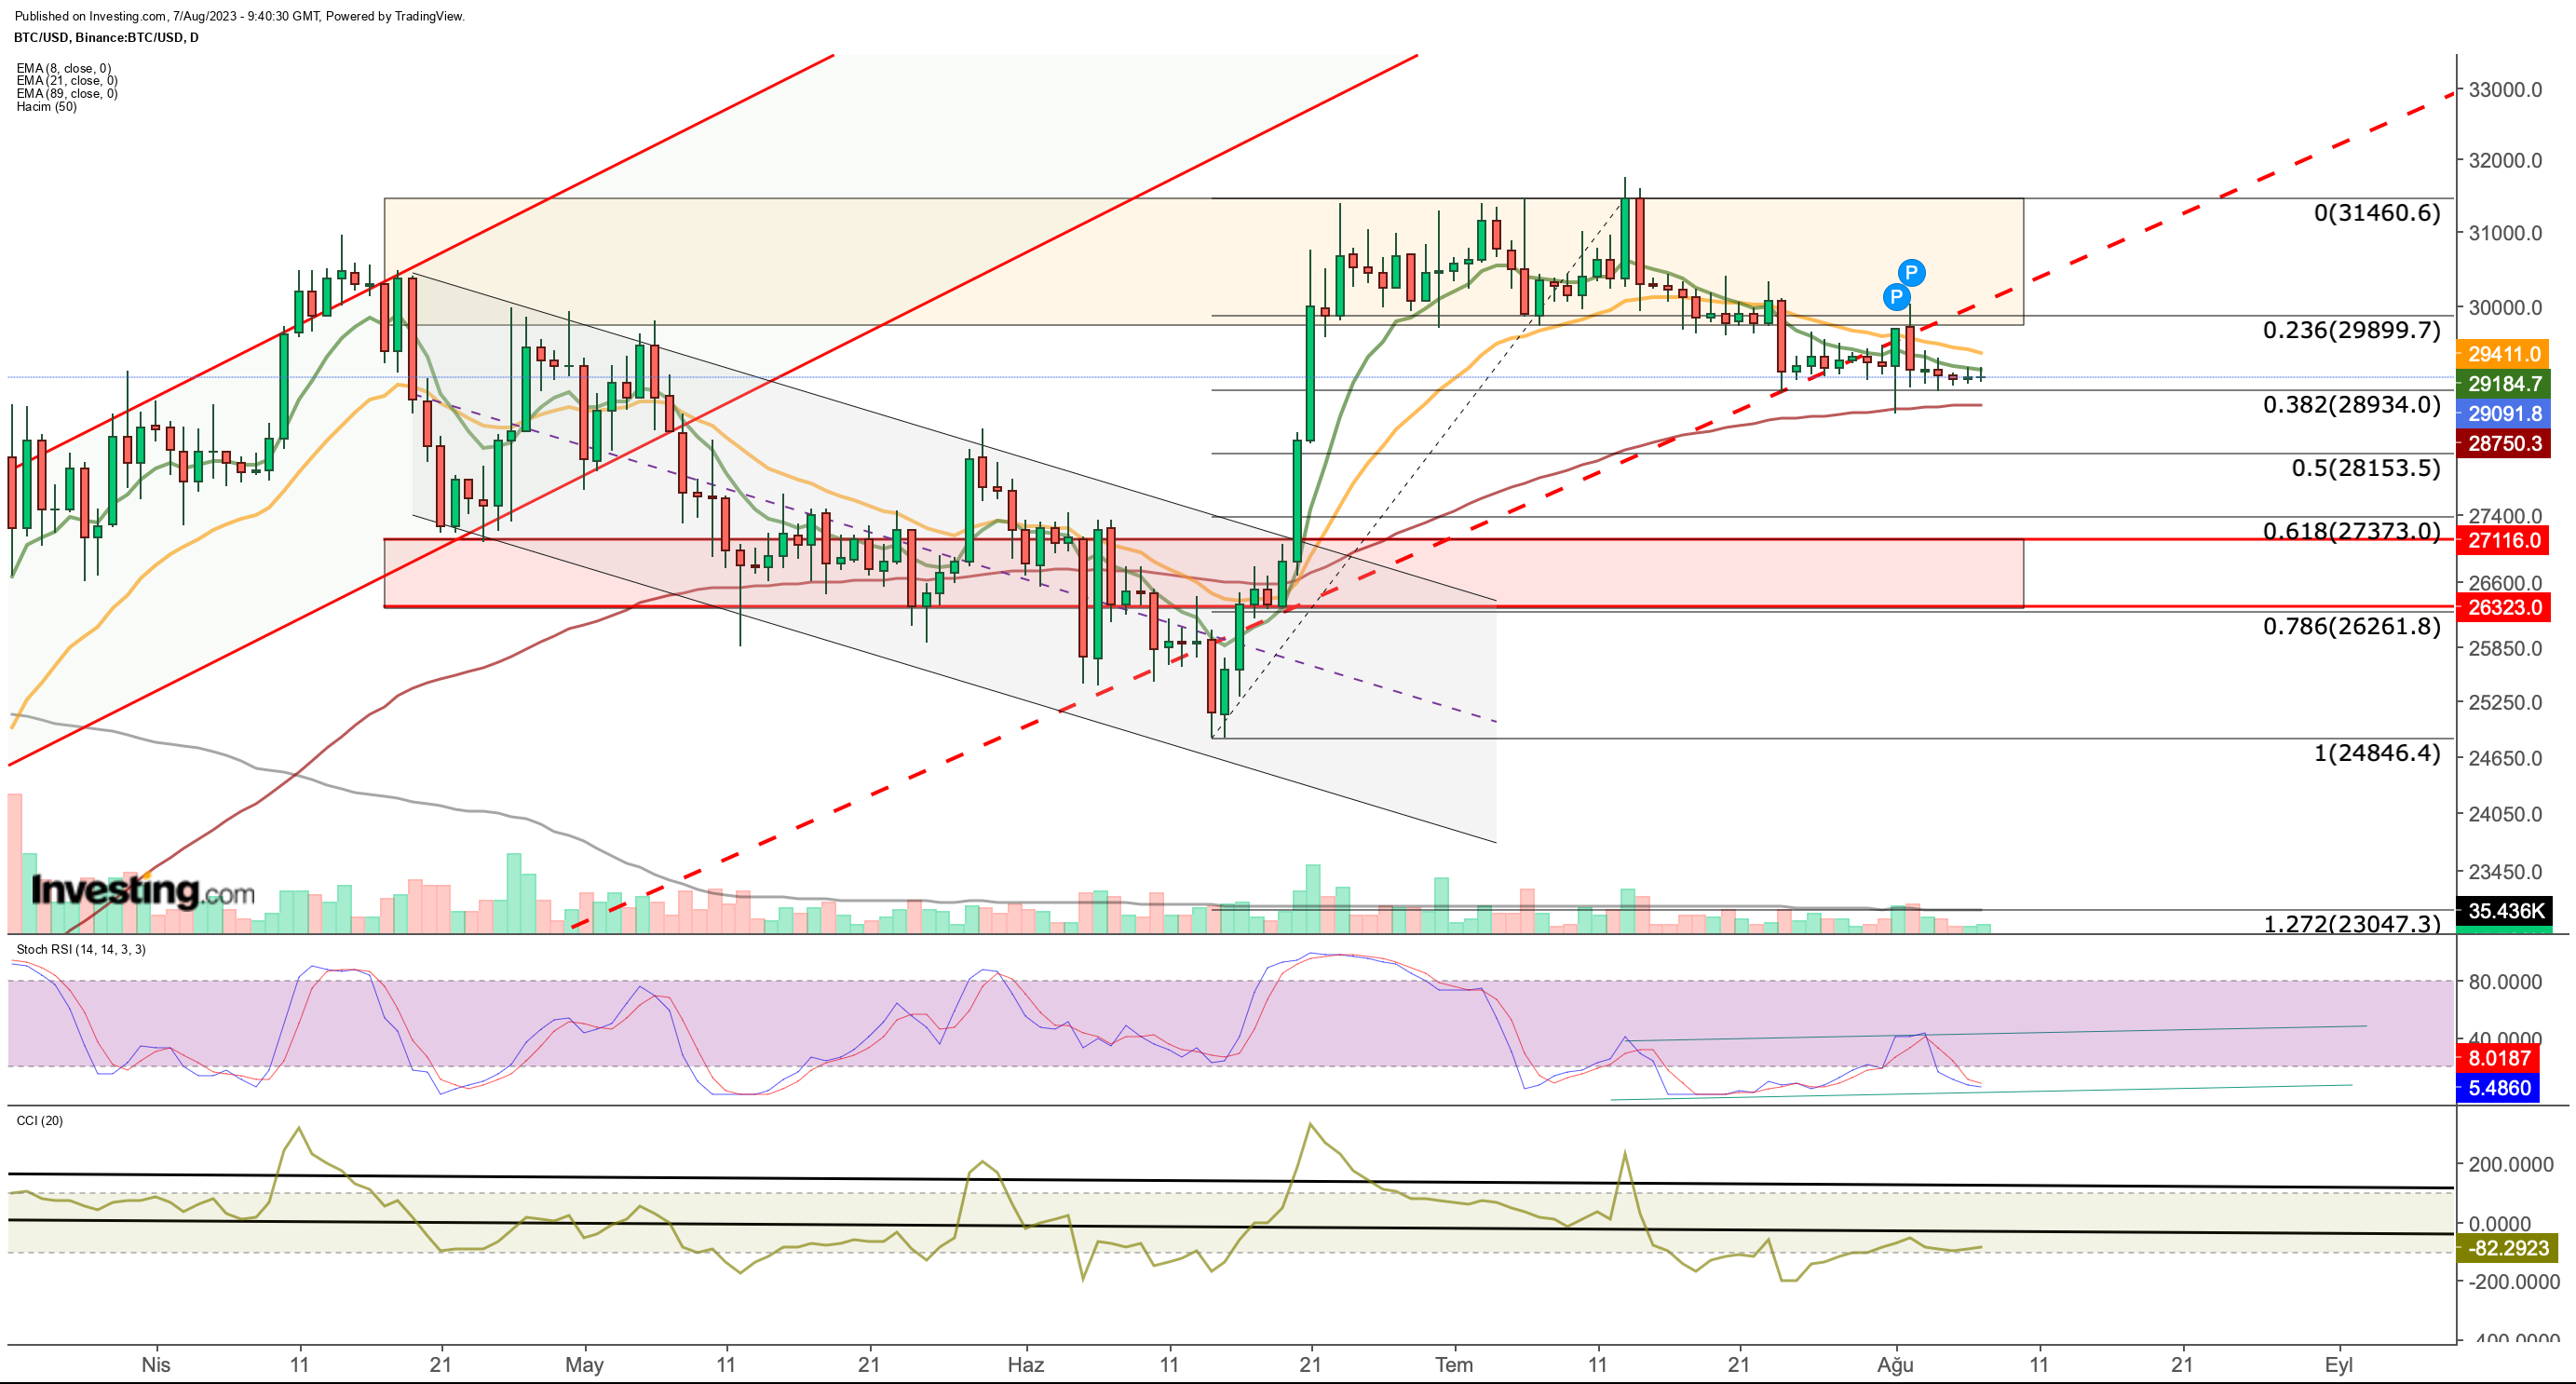
In July, Bitcoin slipped below the $30,000 support, and now this area has turned into a resistance level.
As we enter August, the attempts to break through the $30,000 barrier are weak, confirming that the selling pressure is still significant.
After experiencing volatile price movements at the beginning of last week, Bitcoin stayed stagnant at the $29,000 mark, and it continues to show a downward trend with low volume.
 Last week, Bitcoin broke below the 2023 uptrend, marking the second time this year it violated the trend.
Now, an intermediate support level around $28,750 has become crucial for the coming days. This area corresponds to Fib 0.382 of the trend that started from $25,000 in June and reached $31,500. The 3-month EMA value also acts as another support line at $28,750.
If Bitcoin closes below the $28,750 - $28,900 range this week, it could trigger rapid downward movements, potentially leading to a short-term drop to $26,000. The short-term exponential moving average (EMA) values also support a bearish outlook, as the 8-EMA crossed below the 21-EMA, creating dynamic resistance around $29,200 to $29,400.
On the other hand, signs of buying weakness are evident in the Stochastic RSI on the daily chart, which remains in oversold territory. An upside breakout point could be found if Bitcoin tests the $30,000 band again and achieves daily closes in that region, leading to potential upside reactions.
In conclusion, the price levels of $28,750 on the lower side and $30,000 on the upper side will be closely monitored to determine Bitcoin's next direction. The upcoming US inflation data, especially the US core inflation, will be crucial in influencing the crypto markets' volatility.
The inflation data will also significantly shape the Federal Reserve's interest rate decisions. Although there is no FOMC meeting in August, another inflation data release before the September meeting could impact risky markets, making it important for US inflation to show positive signs for potential recovery in August without Fed pressure.
Ethereum's Important Levels to Watch
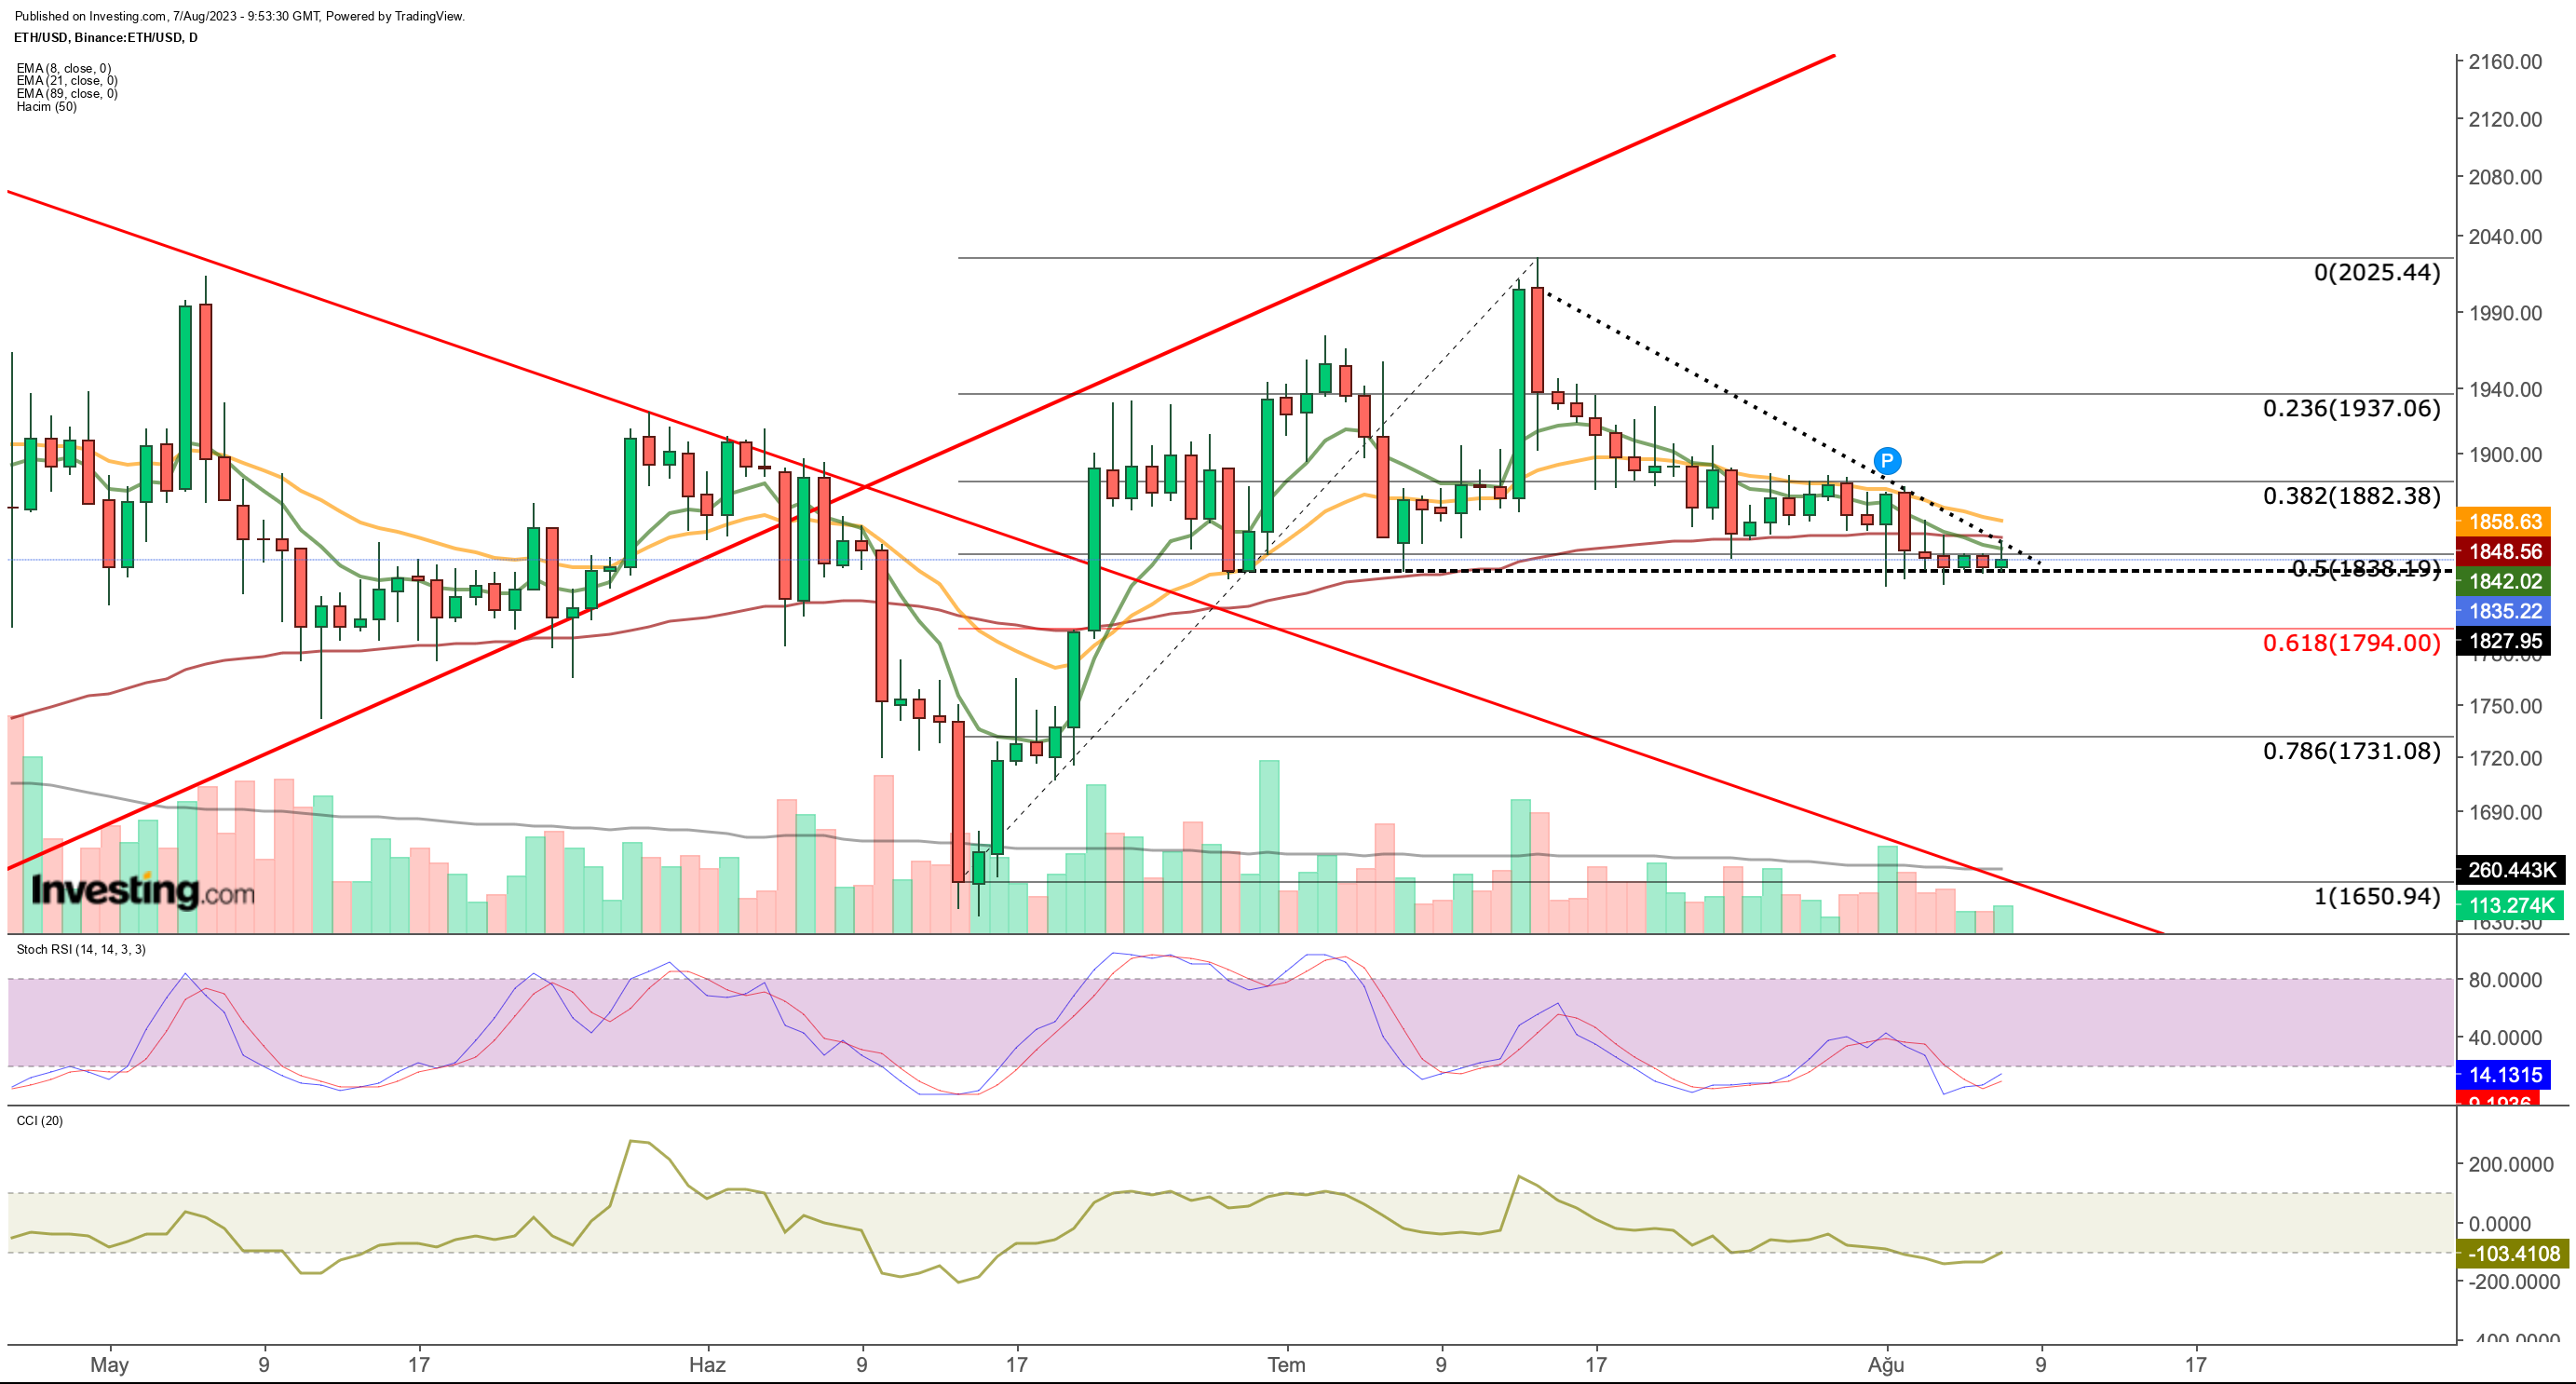
Ethereum has been experiencing a gradual downtrend since it was rejected at the $2,000 level last month.
Last week, Ether found support at $1,850, and then it started to seek support at $1,825. The current outlook suggests that the cryptocurrency is trading from $1,825 to $1,850.
 If we see daily closures below $1,825 in this week's transactions, it may accelerate the downward momentum. This is because short-term EMA values are likely to move below the 3-month EMA value, which is considered a bearish signal.
A possible bearish momentum could cause Ethereum to decline to $1,730 initially, and if it fails to hold this support, it could drop further to $1,650.
On the other hand, a recovery can be anticipated if Ethereum surpasses the $1,880 mark. Daily closes above this value could reverse the negative outlook and potentially lead Ethereum to start a short-term uptrend toward $2,150.
In conclusion, the Ethereum price must maintain the $1,825 level this week to avoid further losses and potentially pave the way for a positive turnaround.
***
Disclaimer: This article is written for informational purposes only; it does not constitute a solicitation, offer, advice, or investment recommendation. As such, it is not intended to incentivize the purchase of assets in any way. I would like to remind you that any asset, is evaluated from multiple perspectives and is highly risky therefore, any investment decision and the associated risk remains with the investor.
