- Breaking free from a month-long sideways trend, Bitcoin surged past $64,000 earlier this week but has moved back below it for now.
- Meanwhile, funds continue to flow into the ETFs, causing a demand surge.
- Bitcoin's weekly chart signals potential movement toward the $80,000 target, with key support now at $57,700 and short-term resistance at $63,000.
- In 2024, invest like the big funds from the comfort of your home with our AI-powered ProPicks stock selection tool. Learn more here>>
Earlier this week, Bitcoin broke out of a sideways trend that started in early February. The cryptocurrency surged toward $64,000 in the first days of the week and has since hovered around $63,000.
In last week's analysis, we emphasized Bitcoin's $50,700 support as crucial by the end of the week. It was essential for Bitcoin to close above this support before the weekend.
In the 48 hours that followed, buyers managed to push Bitcoin's price above $51,700 after absorbing the selling pressure. Consequently, Bitcoin avoided a correction.
The $55,000 zone, identified as a short-term resistance, was swiftly breached.
Bitcoin: Medium-Term View
Let's first take a look at the latest outlook on the weekly chart to predict what could come next.
Although Bitcoin made a partial retreat yesterday, it started to form support around the $60,000 band.

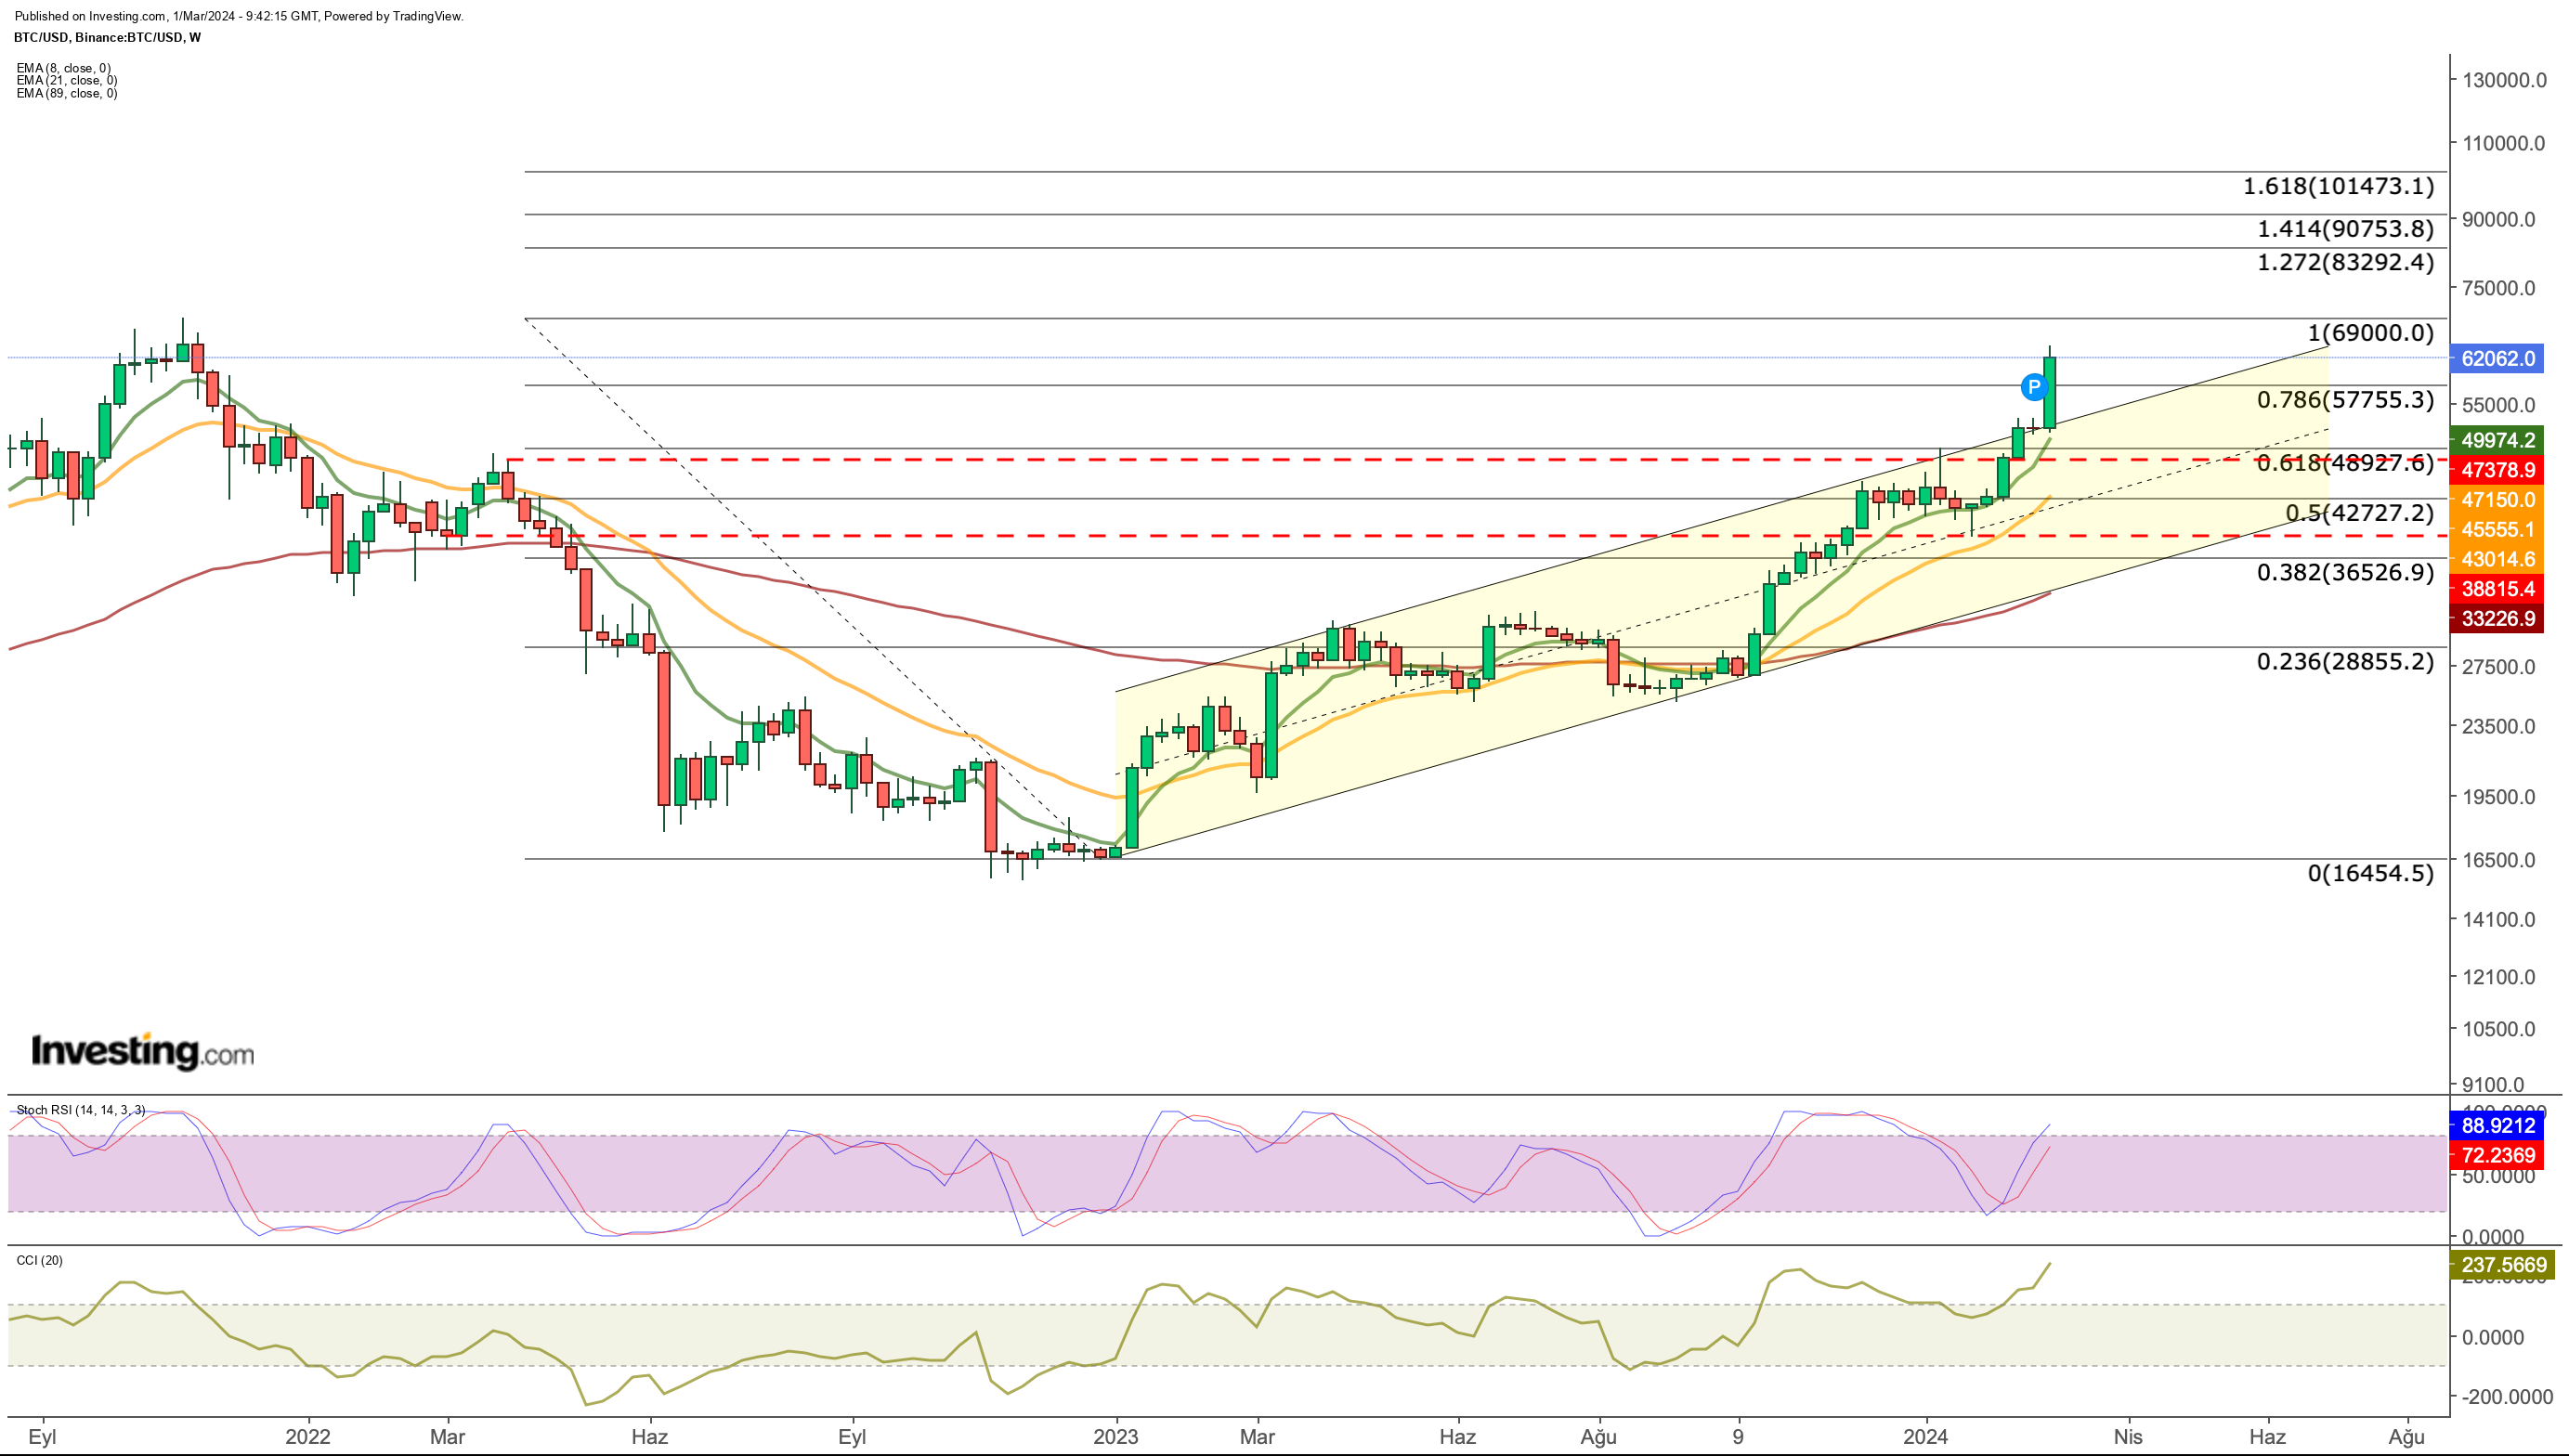
As seen on the weekly chart, the long-term resistance point Fib 0.786, calculated as 57,755 this week, was also passed without any problems.
According to the current outlook, the next target is seen as the last peak at $69,000.
We also see that Bitcoin has violated the ascending channel for the first time since the beginning of 2023.
This exponential growth allows the Stochastic RSI, which is currently continuing its upward trend on the weekly chart, to signal that the trend may continue.
If the Stochastic RSI creates a cycle similar to the last quarter of 2023, it has the potential to trigger the cryptocurrency's movement toward its medium-term target of $ 80,000.
On the other hand, the main level that can act as a support point in possible pullbacks is at $ 57,700, which was just crossed this week.
Although this area has been decisively broken, it may become important as a support point this time in possible pullbacks.
Let's go back to shorter timeframes to identify closer support and resistance levels for now.
Bitcoin: Short-Term View
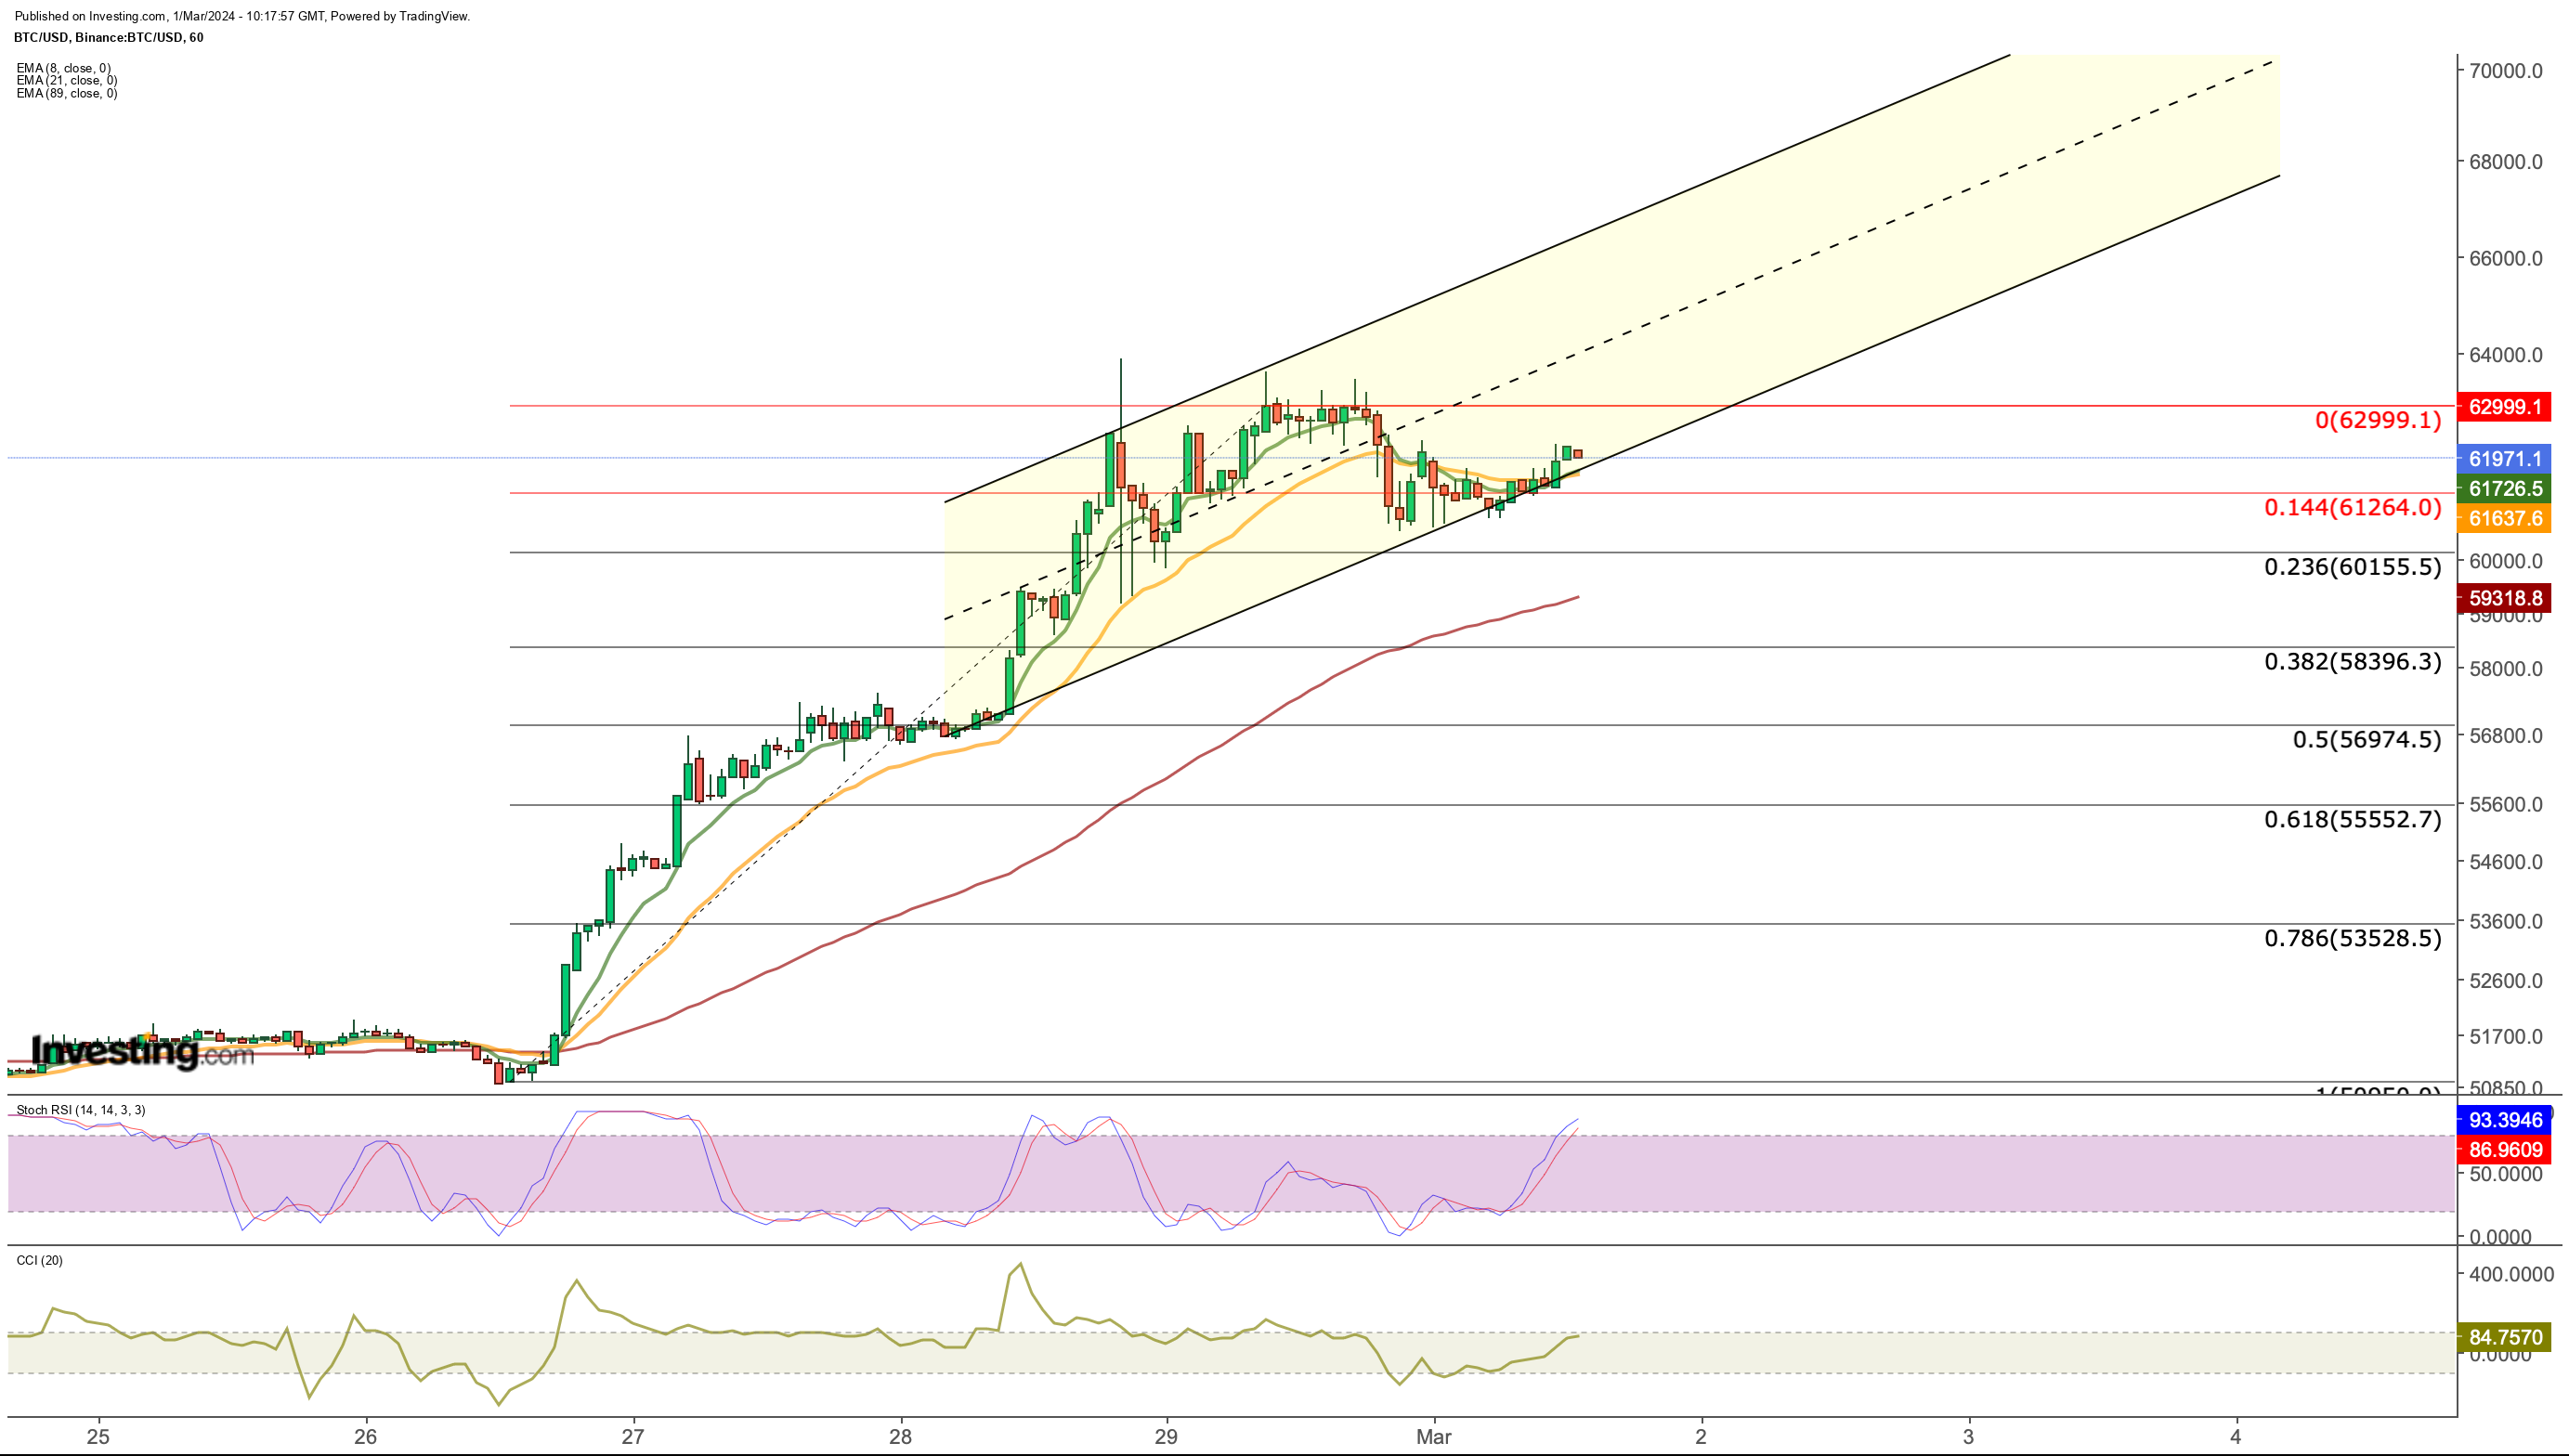
The hourly chart shows that the uptrend encountered resistance at an average of $63,000. Sales from this point are met at an average of $ 61,250 in the lower region.

Therefore, we will follow the closest support point as $ 61,250 in possible retracements.
In case of sagging from this price, $ 60,150 will become important. Further pullbacks may trigger a decline toward the long-term major support point in the $ 57,000 region.
Above, it is possible to see a quick bounce towards the $65,000 region on daily closes above the last resistance point at $63,000. If this price level can be broken, we could see the next move towards the last record high at $69,000.
In summary, it has become important to maintain the closest support of $ 61,250 with daily closes in the next few days. Then, the aforementioned resistance prices will be closely monitored for the continuation of the trend.
The flow of funds into the spot ETF market keeps driving the rapid growth in Bitcoin demand.
To sustain this demand in the upcoming days, risk appetite must stay high.
This is contingent on the economic data from the United States, potentially causing further demand surges.
***
Take your investing game to the next level in 2024 with ProPicks
Institutions and billionaire investors worldwide are already well ahead of the game when it comes to AI-powered investing, extensively using, customizing, and developing it to bulk up their returns and minimize losses.
Now, InvestingPro users can do just the same from the comfort of their own homes with our new flagship AI-powered stock-picking tool: ProPicks.
With our six strategies, including the flagship "Tech Titans," which outperformed the market by a lofty 1,427.8% over the last decade, investors have the best selection of stocks in the market at the tip of their fingers every month.
Subscribe here and never miss a bull market again!
Don't forget your free gift! Use coupon code INVPROGA24 at checkout for a 10% discount on all InvestingPro plans.
Disclaimer: This article is written for informational purposes only; it does not constitute a solicitation, offer, advice, or recommendation to invest as such it is not intended to incentivize the purchase of assets in any way. I would like to remind you that any type of asset, is evaluated from multiple points of view and is highly risky and therefore, any investment decision and the associated risk remains with the investor.

