- Bitcoin faced selling pressure throughout the week, experiencing a pullback from the $44,000 area and prompting a focus on its consolidation phase.
- The $42,700 level, acting as a pivot point, is transitioning from support to resistance, with low trading volume limiting significant price movements.
- The critical support at $41,300 holds significance, and a weekly close below this level could signal a potential decline, while maintaining it may pave the way for a bullish start to 2024.
- Looking to beat the market in 2024? Let our AI-powered ProPicks do the leg work for you, and never miss another bull market again. Learn More »
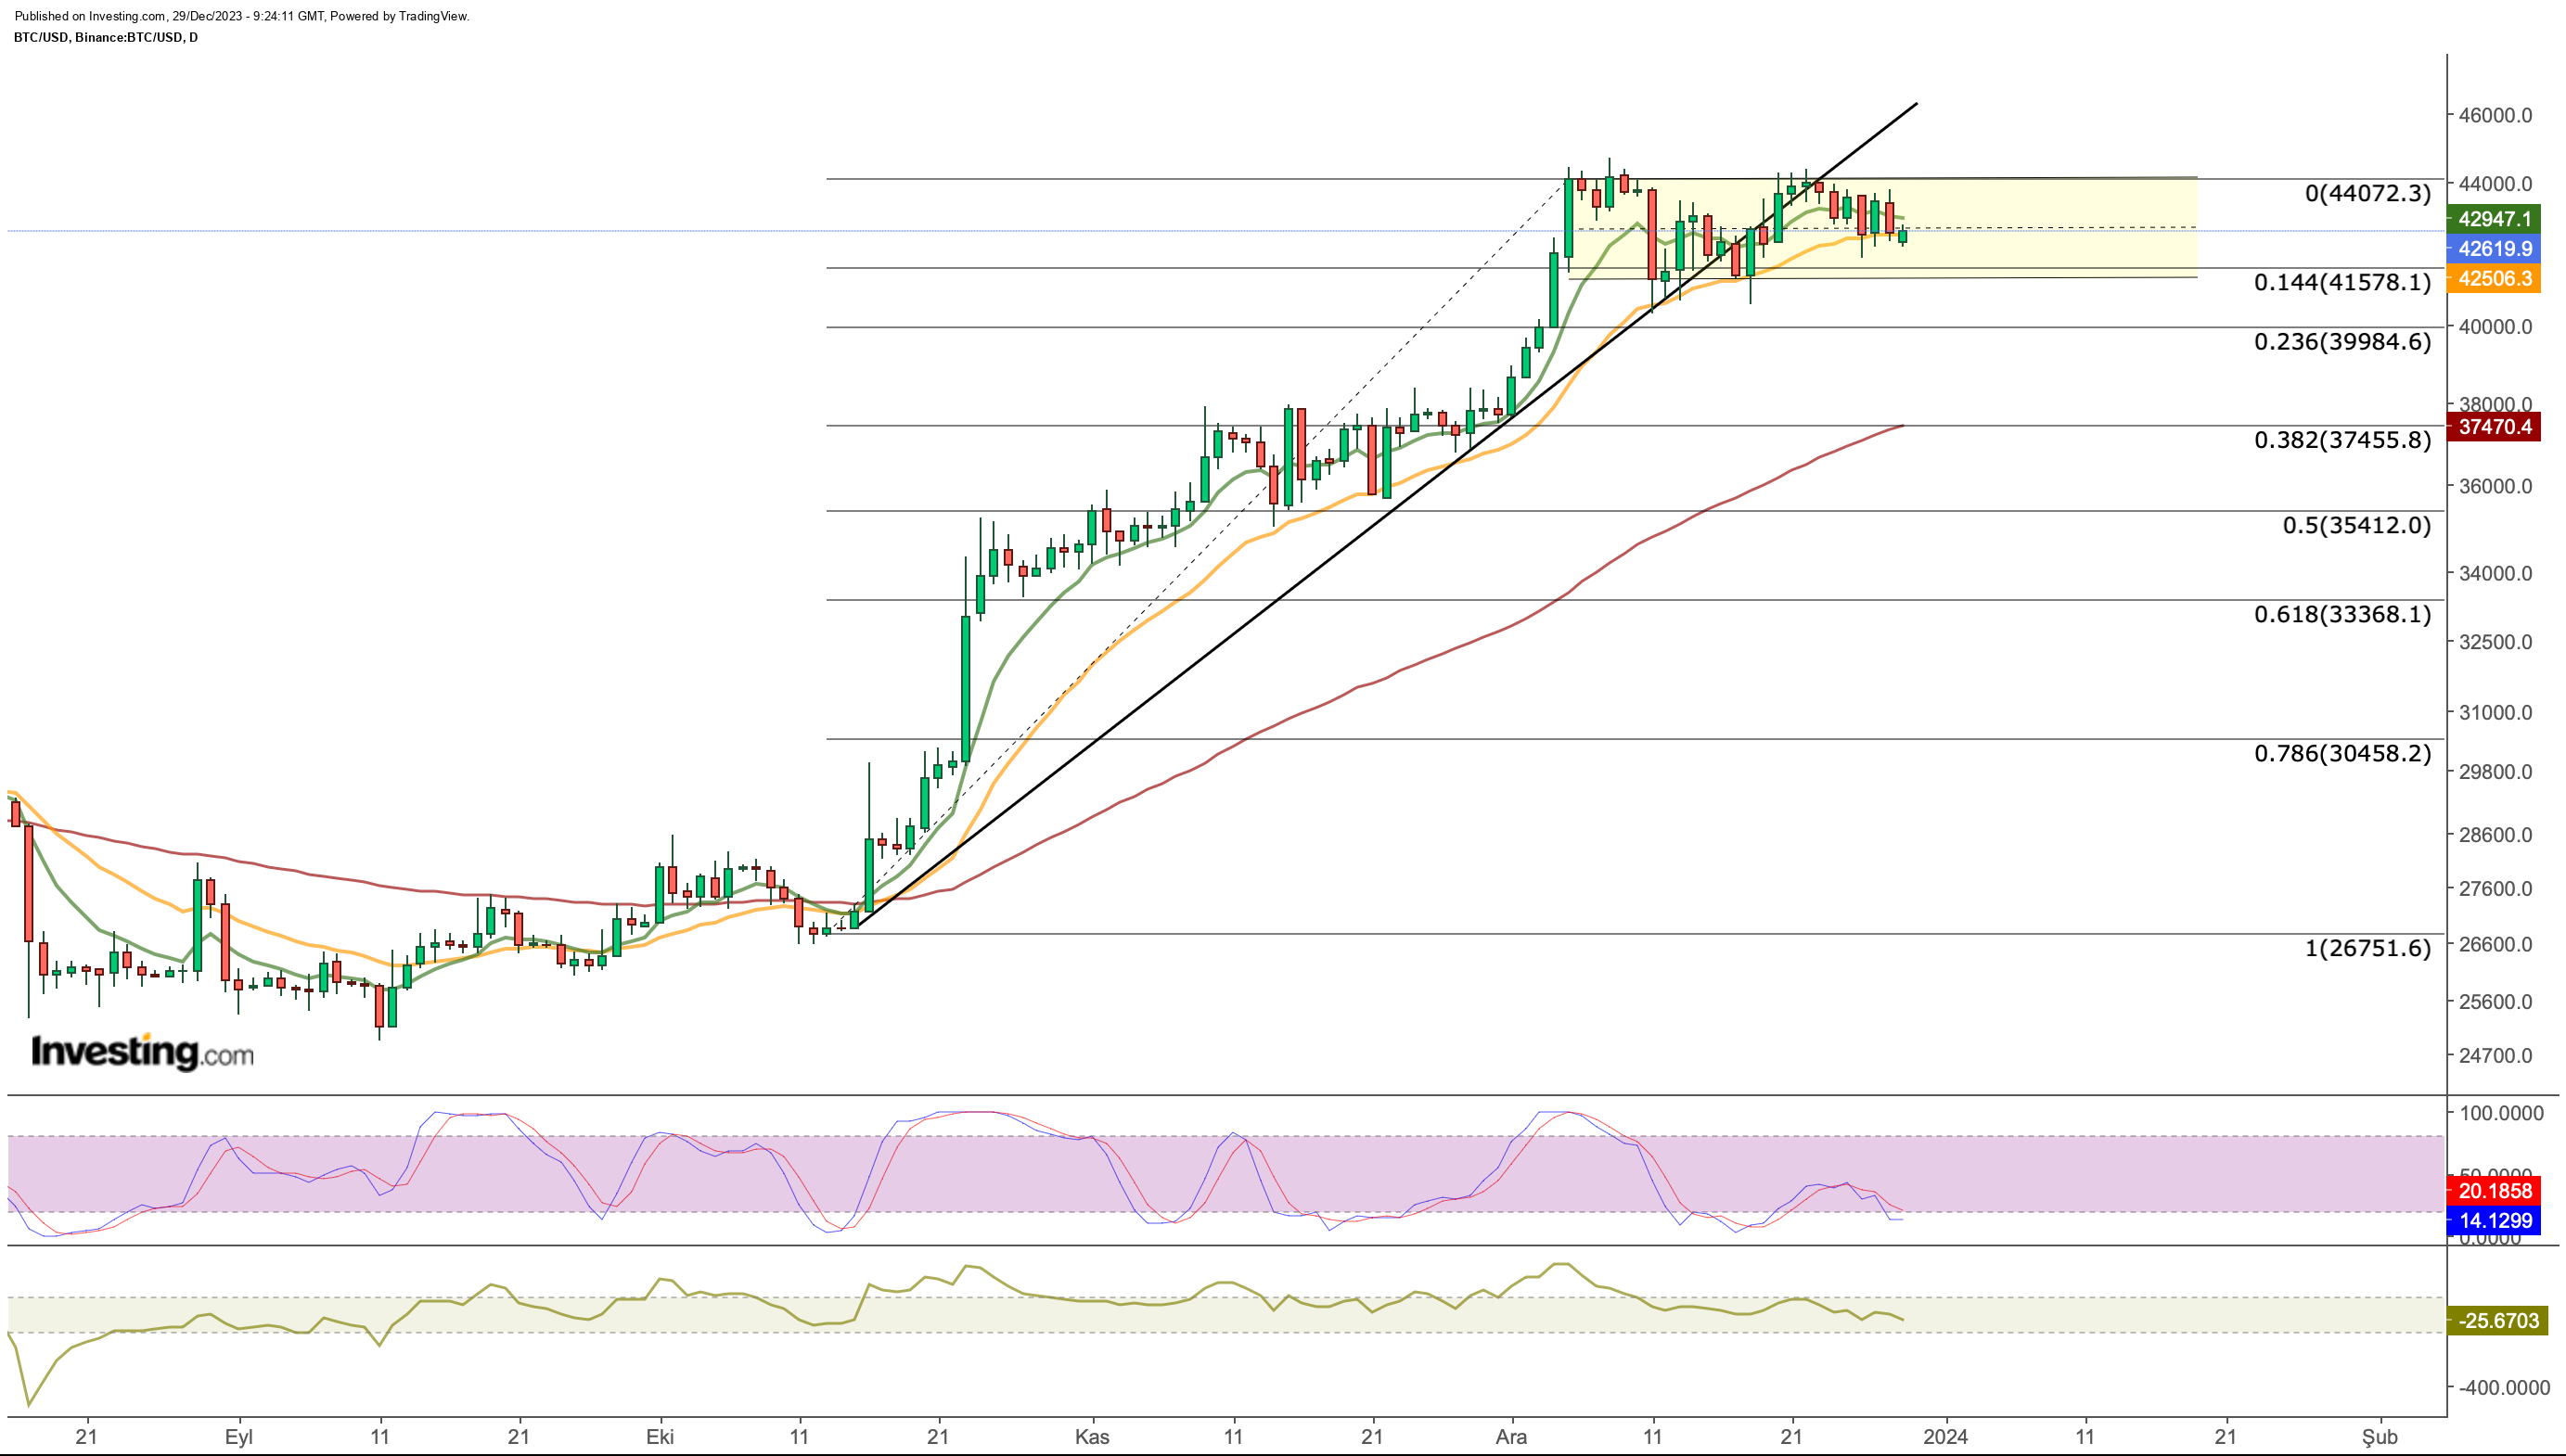
Throughout the week, Bitcoin faced selling pressure once again as it was rejected from the upper band within the channel movement observed since the beginning of December.
The cryptocurrency experienced a pullback from the $44,000 area during the previous week's upward trend, causing it to dip below the ongoing uptrend and lose momentum.
Although the current breakout hasn't resulted in a sharp decline, it suggests a prevailing belief that Bitcoin could sustain its upward trajectory.
Currently, our focus remains on Bitcoin's consolidation phase. Following sales from the upper band, levels near the middle band of the channel served as intermediate support throughout the week.
On the final trading day of the week, the $42,700 level, identified as a pivot point, appears to be transitioning from support to resistance.
Low trading volume in the last days of the year is limiting significant price movements. Nevertheless, it remains crucial to uphold the support line, which dipped to $42,500 during the week, to prevent a further increase in selling pressure.
Additionally, this region aligns with the 21-day EMA, acting as dynamic support in the recent short-term upward trend since October.
As Bitcoin moves below this dynamic support, a day's close below the 21-EMA may trigger the next move toward the lower band of the channel. 
In case of continued selling pressure, the region corresponding to the 41,300 - 41,500 dollar line appears as a more critical support.
A possible pullback to this level could be decisive for BTC's new direction. A weekly close below the $ 41,300 level, which has been maintained throughout December, will increase the likelihood that Bitcoin will start the new year with a decline.
This could trigger the cryptocurrency to retreat to the $39,900 band and then to the $37,500 level. However, as we emphasized last week, these regions can be considered as a healthy retracement for the medium-term trend to continue upwards.
In a more optimistic scenario, BTC's staying within the channel will be effective.
Accordingly, a year-end close above $41,300 could increase the risk appetite of buyers in the first week of 2024 and we could see BTC make one more move to break the current channel upwards.
In a possible breakout, the target prices we follow on the weekly chart will come back to the agenda.

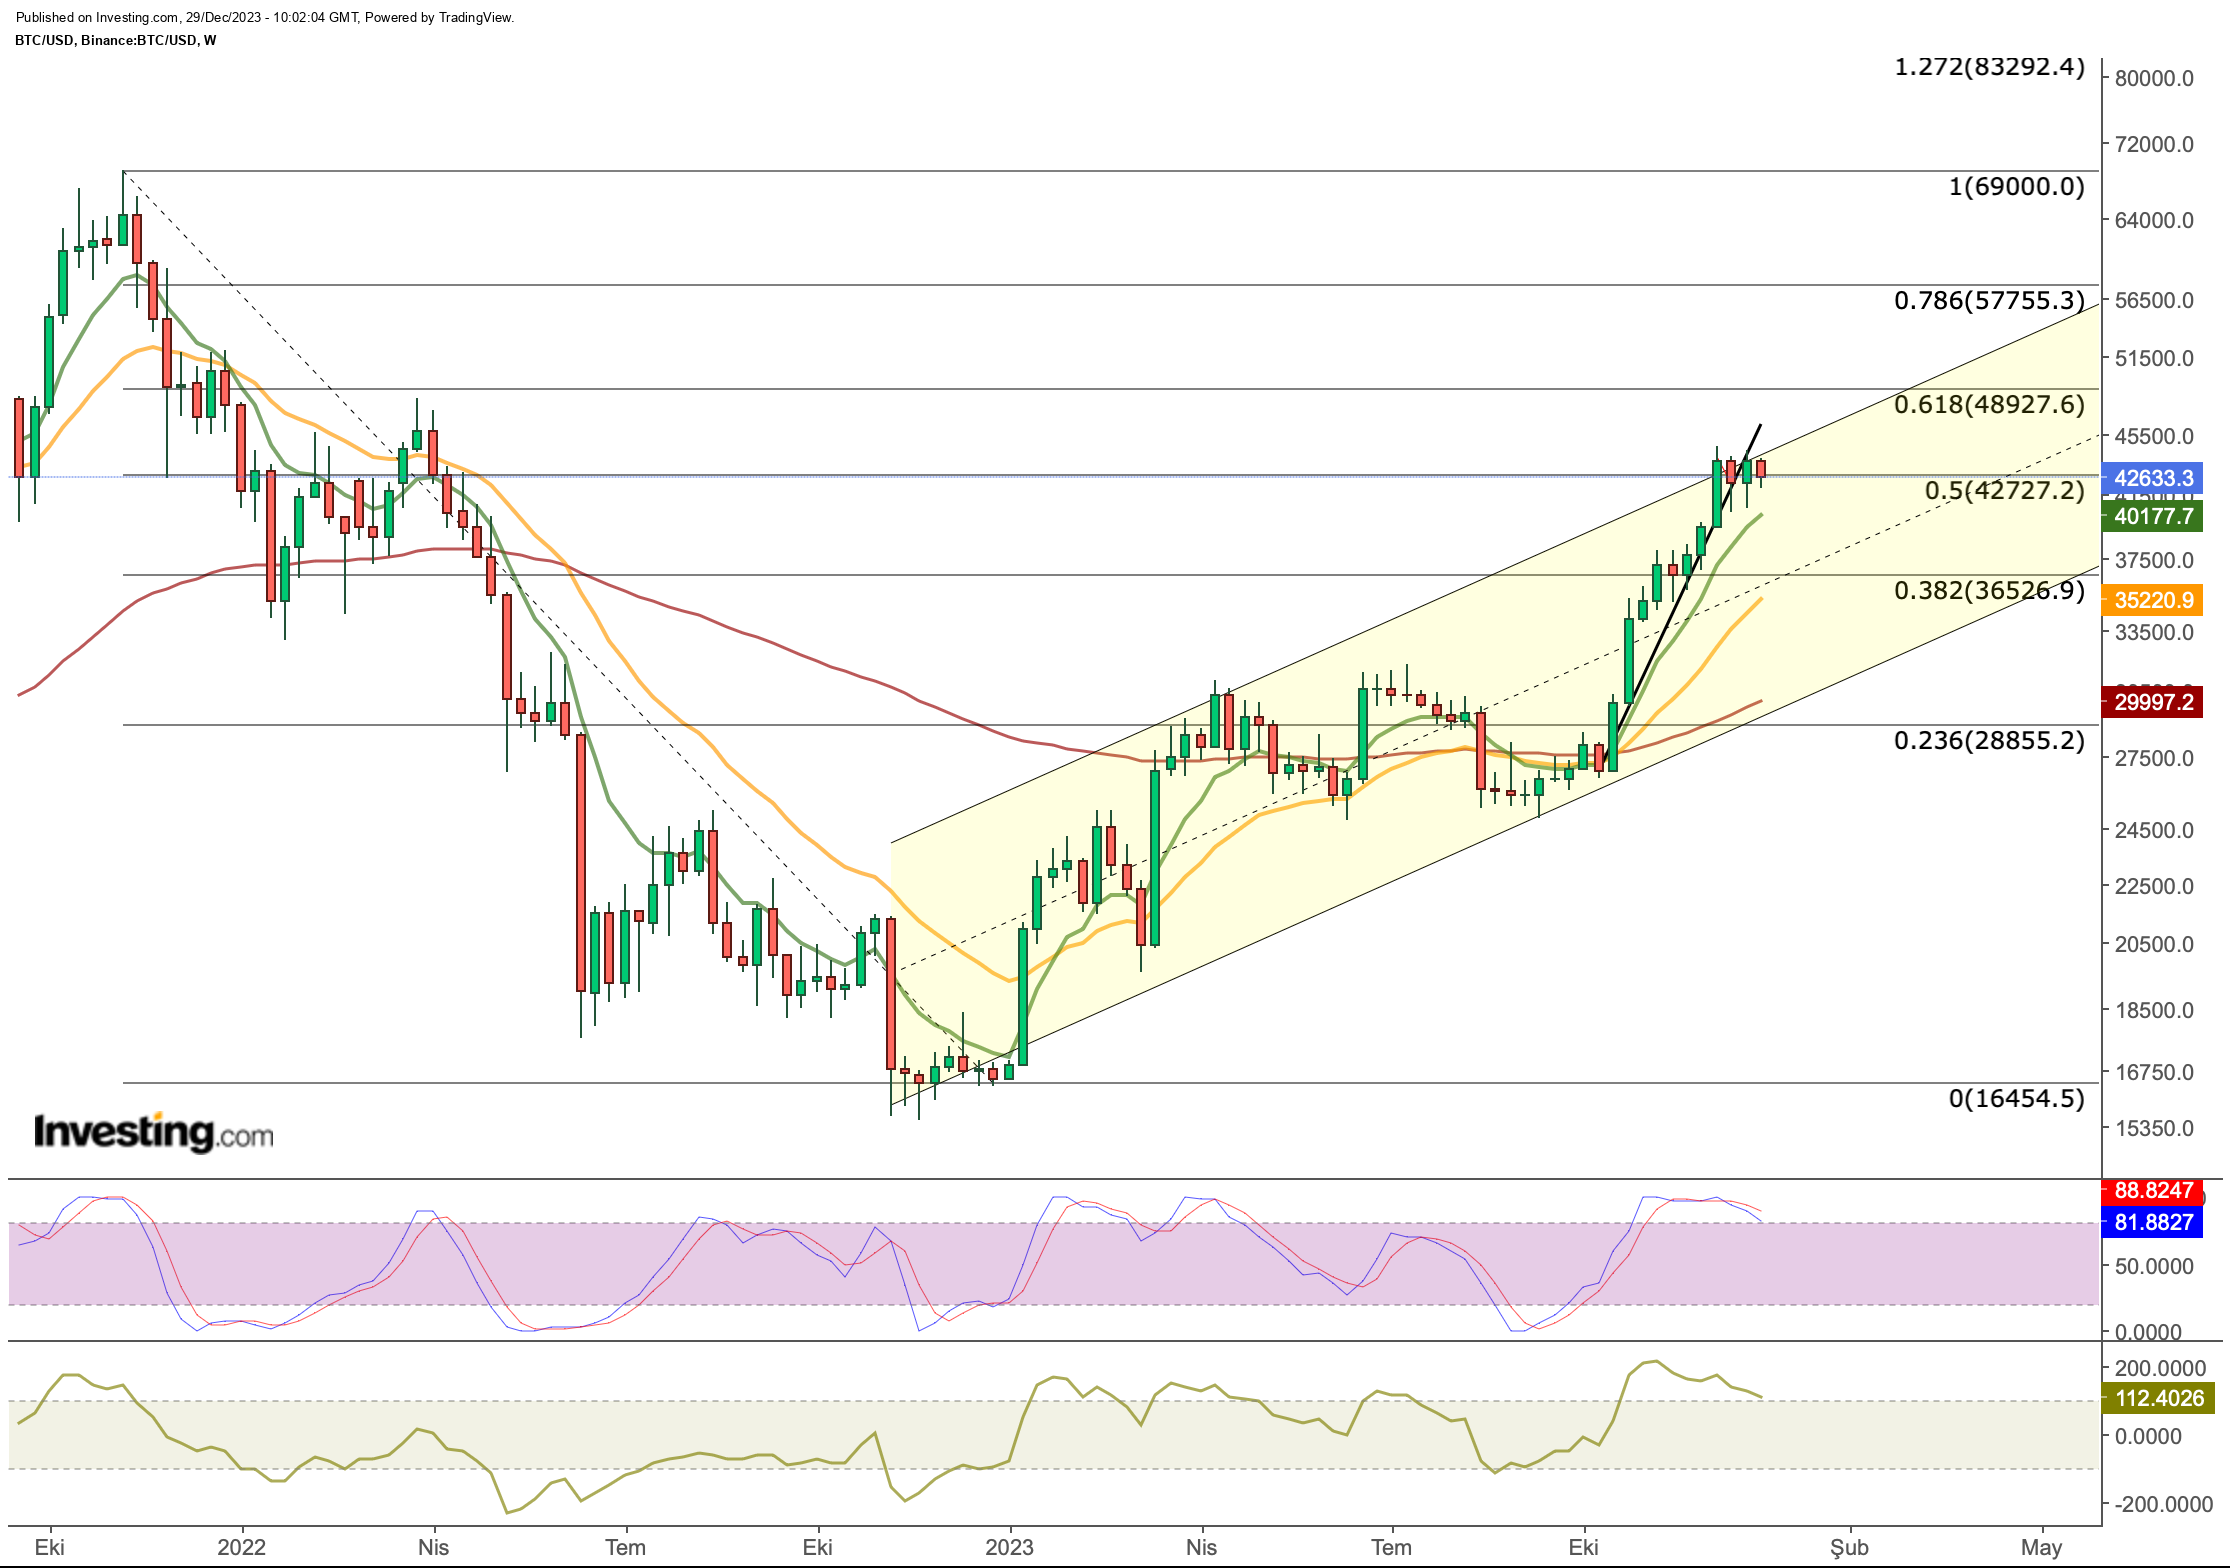
As can be seen more clearly on the weekly chart, Bitcoin is stuck at the upper band within the 2023 ascending channel.
Considering recent technical developments, the fact that the demand remains alive prevents the cryptocurrency from retreating from this region.
Technically, the importance of the average support of $ 42,700 emerges once again. Therefore, a weekly close away from this point can be considered as a warning for the correction trend.
On the other hand, the continuation of positive news will support the upward movement along the upper band and the $ 49,000 level may come to the agenda as the next stop.
In summary, the weekly close below $ 42,700 technically signals the beginning of a correction. Therefore, it has become extremely important to maintain this level to maintain the trend.
***
In 2024, let hard decisions become easy with our AI-powered stock-picking tool.
Have you ever found yourself faced with the question: which stock should I buy next?
Luckily, this feeling is long gone for ProPicks users. Using state-of-the-art AI technology, ProPicks provides six market-beating stock-picking strategies, including the flagship "Tech Titans," which outperformed the market by 670% over the last decade.
Disclaimer: This article is written for informational purposes only; it does not constitute a solicitation, offer, advice, counseling or recommendation to invest as such it is not intended to incentivize the purchase of assets in any way. As a reminder, any type of asset, is evaluated from multiple perspectives and is highly risky, and therefore, any investment decision and the associated risk remains with the investor.

