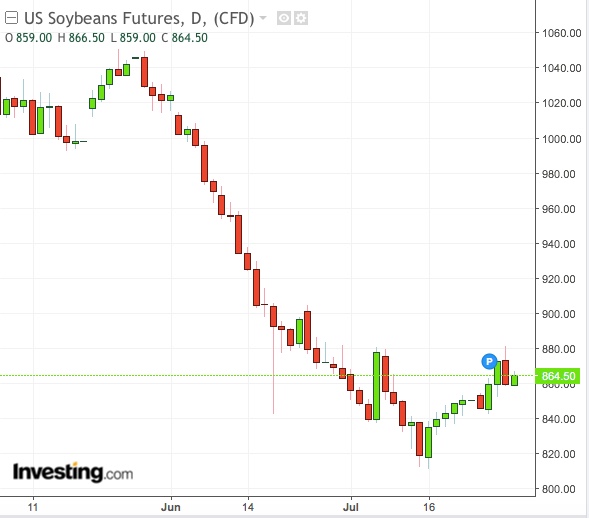
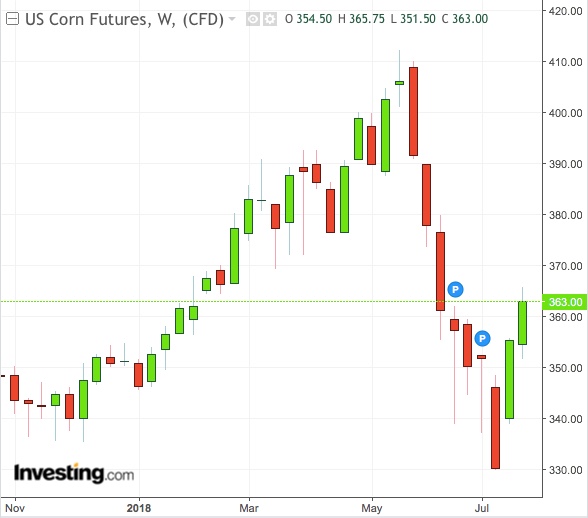
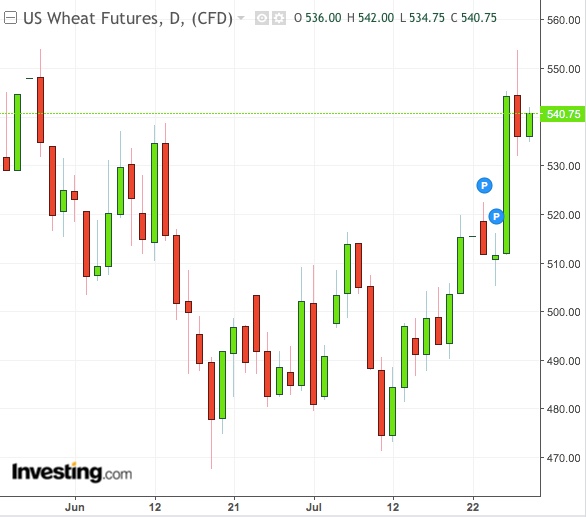
They were down double digits just a month ago on the combined effects of the strong dollar and demand concerns. Now, soybeans and corn are staging one of the most powerful comebacks in commodities.
Joined by wheat, which also fell in June—albeit moderately—the three premier US agriculture markets are indicating bountiful gains through August for investors who believe in the grains rally.
Since the dollar’s about-turn last week from one-year highs, global commodity markets have been left to find their own way through unique supply-demand fundamentals. And most have much to do on price recovery.
US crude oil is down more than 6 percent for July, its sharpest monthly loss in 16 months.
Gold is also down, for a fourth straight month, while copper, sugar and coffee are headed for a second monthly loss in a row.
With grains, it’s a different story.
Corn is rallying, resuming its run-up from December that was broken by June’s 11 percent drop – its biggest tumble in two years pressured partly by the resurgent dollar. With three sessions left to July, corn has covered decent ground this month, rising over 3 percent.
For wheat, July has been its strongest in four months, as it rose nearly 7 percent to erase June’s 4% loss. Like corn, wheat has had a good year, rising in five of the past seven months, with April’s rally alone at 13%, in reaction to weak spring output.

While soybeans have the smallest advance of the lot for July – at under 0.5 percent – that’s a rebound from June’s 15 percent slump. Last month was soybean’s worst in four years as the market was pummeled by fears about the ongoing row on tariffs between Washington and Beijing, and what that could do to the soy trade in China, the largest consumer of the oilseed.
“Strong Buy” Across The Board
Investing.com’s daily technicals indicate a “Strong Buy” for all the three major US agricultural markets.
Analysts predict more gains, over the next month at least.
“We believe that the US dollar is in the process of topping out. We think that by August the top will be complete and lead to an accelerated move down into the fall, adding a bullish tail wind to Ag commodity markets,” said Shawn Hackett of Hackett Financial Advisors, a Boynton Beach, Florida-based investment advisory specializing in US agriculture.
“We expect a series of rolling informed smart money algorithm buy signals in the ag complex to provide additional clues on the timing of the bullish turn,” Hackett wrote in a weekly note.
Corn Rising On Ethanol Demand
The rally in corn was largely supported by demand for ethanol, the biofuel additive mandated at gas pumps, ADM Investor Services said in a separate note on Thursday.
Ethanol production for the week ending July 20 averaged 1.074 million barrels per day, up 0.94% on the week and 6.13% higher on the year.
ADM noted that corn use needed to average 88.256 million bushels per week to meet this crop year's estimate of 5.575 billion bushels by the US Department of Agriculture. Stocks as of July 20 were 21.653 million barrels, down 0.53% from a week ago.

“All of these suggest to us that an early harvest low will be seen in the corn market with August as the likely month for a bullish turning point,” Hackett said. “The $3.40 per bushel area remains strong support on spot prices.”
Investing.com’s daily Fibonacci technicals for corn indicate support from $3.5998 to $3.5658 per bushel and resistance from $3.6418 to $3.6758, with the pivot at $3.6208.
Limited Rainfall For Soybeans
For soybeans, crop conditions were expected to come in weaker than expected, with the growing belt in the far West seeing limited rainfall starting in late July and into August, ADM said in a note from earlier in the week.
Hackett thinks that with the Chinese being the biggest soy consumers, prices of the bean and oilseed could benefit immensely with an easing of the current US-China tariffs war.
“This would support the notion of an early harvest low with August as the ideal window for a bullish turning point,” he added. “The $8.40 area remains strong support on spot prices.”
Investing.com’s daily Fibonacci technicals for soybeans indicate support from $8.5748 to $8.4342 per bushel and resistance from $8.7486 to $8.8892, with the pivot at $8.6617.
Canadian Wheat Output Falters, China Stockpiles Tumble
For wheat, ADM cited continuing concerns about dry weather over the next two weeks in the Brazilian Parana state’s key wheat-growing areas. The 2018-19 Canadian all wheat output had also been lowered to 30.6 million tonnes, from a June estimate of 31.1 million, it said, quoting Agri-Food Canada.

Hackett adds that global wheat ending-stocks to usage out of China were at 10-year lows. “The wheat market remains explosive here especially for high quality wheat. Strong support remains near $5.25 on MN (Hard Red Winter) wheat and $4.75 for (Kansas) Winter Wheat.”
Investing.com’s daily Fibonacci technicals for wheat indicate support from $5.3227 to $5.1883 per bushel and resistance from $5.4889 to $5.6233, with the pivot at $5.4058.
Which stock should you buy in your very next trade?
With valuations skyrocketing in 2024, many investors are uneasy putting more money into stocks. Unsure where to invest next? Get access to our proven portfolios and discover high-potential opportunities.
In 2024 alone, ProPicks AI identified 2 stocks that surged over 150%, 4 additional stocks that leaped over 30%, and 3 more that climbed over 25%. That's an impressive track record.
With portfolios tailored for Dow stocks, S&P stocks, Tech stocks, and Mid Cap stocks, you can explore various wealth-building strategies.
