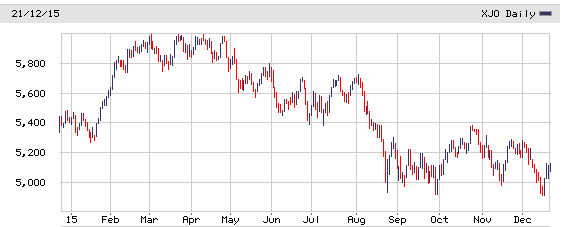
This year it looks like that at best, the Australian stock market will end at around the same level where it finished in 2014. This is certainly a surprise for those who were getting excited back when the ASX 200 was repeatedly testing 6000 during March – May. The major drags on the market have been China and commodities, both of which I have flagged as major risks for a few years.
The Chinese economy was always going to cool and commodities prices were always going to fall from their historic highs. Despite this, various “wise heads” kept talking up the “super commodities cycle” and most seemed to go long for the ride. As a consequence the Australian economy is not transitioning – it’s reacting to a whole new economic outlook and will continue to do so for at least the next year or so.
The nasty reality of how unbalanced the Australian economy is is reflected by the struggling ASX 200 Index which as of today, is just holding above 5000.
ASX 200 1 Year Candlestick Chart
At the current level, the ASX 200 is within the trading ranges I outlined in ASX All Ordinaries Index: Charts, Analysis & Trading Ranges back in 2013 I am not inclined to adjust those ranges just yet. In other words at around 5000 I am a cautious buyer, maybe, and when the market breaks out towards 6000 then I’d be looking at taking some profits.
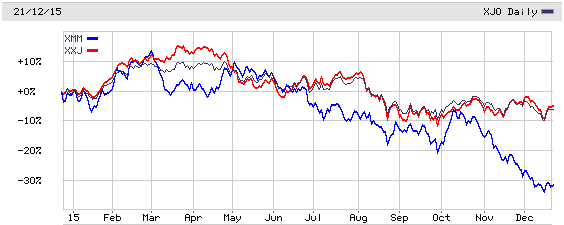
As discussed before in other articles, the ASX 200 is largely driven by the major financial and major mining related stocks. If both these sectors struggle then the ASX won’t break through and hold above 6000. At the moment we have the financial stocks in a bit of holding pattern and the mining stocks in a whole world of pain as we can see from the chart below.
ASX 200 Sector Indices: S&P/ASX 300 Metals & Mining and S&P/ASX Financials ex REIT
ASX:XMM is the ASX 200 Metal & Mining Index (shown in blue) and not surprisingly it’s down around 30% this year and down around 40% from around March. That’s a nasty correction by any measure. ASX:XXJ is the ASX 200 Financials (excluding A-REITs) Index (shown in red) and it looks set to finish the year flat after being up around 15% earlier in the year.
Clearly the mining stocks are doing their best to keep the ASX 200 Index down but unlike the mainstream view, I don’t expect this to be the case next year. Rather I expect the mining stocks to recover slightly in 2016 and that it will be the financials that come under some pressure as the Australian economy struggles. (and most likely the “hot” property market cools also)
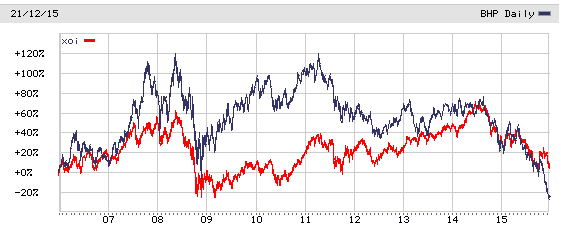
One mining related stock that is in the news for all the wrong reasons is BHP Billiton (L:BLT), but it’s important to remember that BHP is a diversified resources company and has for example, significant exposure to oil and gas. So despite the focus in the finance media about how iron ore and coal prices are hurting BHP profits, the reality is that BHP is taking hits in most business areas.
BHP Billiton and AMEX Oil & Gas Index
The chart above shows the BHP share price plotted along with the ARCA Oil. I’m not suggesting that the BHP stock price is driven by oil and gas prices, but it’s worth remembering that BHP earnings can get a lift if oil prices recover next year even if iron ore remains under pressure. (and vice versa)
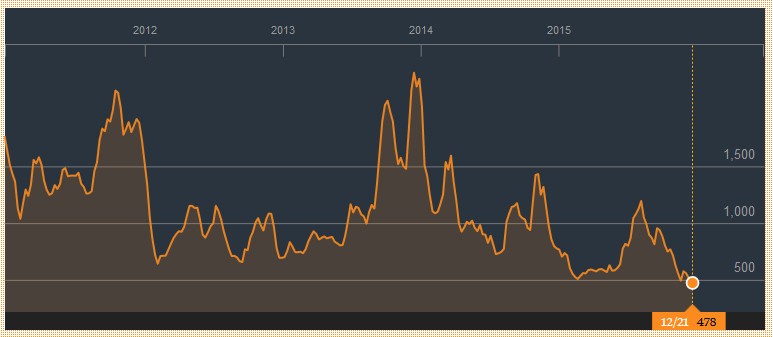
Finally here’s a chart for an Index which is almost universally ignored (and not well understood) by the mainstream finance media – the Baltic Dry Index
Baltic Dry Index 5 Year Chart
(Source Bloomberg)
In simple terms, the Baltic Dry Index or BDI reflects the charter rates shipping companies receive for transporting dry bulk cargoes such as coal, iron ore and wheat. During the boom years an excess of ships that carry this type of cargo were built and this combined with a fall in commodities prices has hit the index hard. Recently for example it slumped to an all time low of 471 and shows few signs of sustained recovery.
The BDI is important because it can be viewed as a leading economic indicator. Therefore I reckon it’s worth watching as it may give us a hint of when commodities prices will start to rise again. Hopefully that will be the case in 2016, but for now it would be a good outcome if the ASX 200 simply limped towards the end of the end without sliding backwards.
This article was written by Greg Atkinson who is the Managing Director of Ohori Capital. Greg is from originally from Sydney but now works and resides in Japan.


