Breaking News
Get 45% Off 0
💰 With a 129% YTD gain in the bag, these are our AI’s top global picks for March
Read now

Australian dollar thrashed as RBA pops inflation bubble

au.investing.com/analysis/australian-dollar-thrashed-as-rba-pops-inflation-bubble-200491336
Australian dollar thrashed as RBA pops inflation bubble
By David Llewellyn-Smith   |  Nov 03, 2021 10:35
Saved. See Saved Items.
This article has already been saved in your Saved Items
 
 
EUR/USD
+0.11%
Add to/Remove from a Portfolio
Add to Watchlist
Add Position

Position added successfully to:

Please name your holdings portfolio
 
AUD/USD
+0.05%
Add to/Remove from a Portfolio
Add to Watchlist
Add Position

Position added successfully to:

Please name your holdings portfolio
 
XAU/USD
-0.12%
Add to/Remove from a Portfolio
Add to Watchlist
Add Position

Position added successfully to:

Please name your holdings portfolio
 
Gold
-0.08%
Add to/Remove from a Portfolio
Add to Watchlist
Add Position

Position added successfully to:

Please name your holdings portfolio
 
Copper
+0.11%
Add to/Remove from a Portfolio
Add to Watchlist
Add Position

Position added successfully to:

Please name your holdings portfolio
 
LCO
+0.36%
Add to/Remove from a Portfolio
Add to Watchlist
Add Position

Position added successfully to:

Please name your holdings portfolio
 

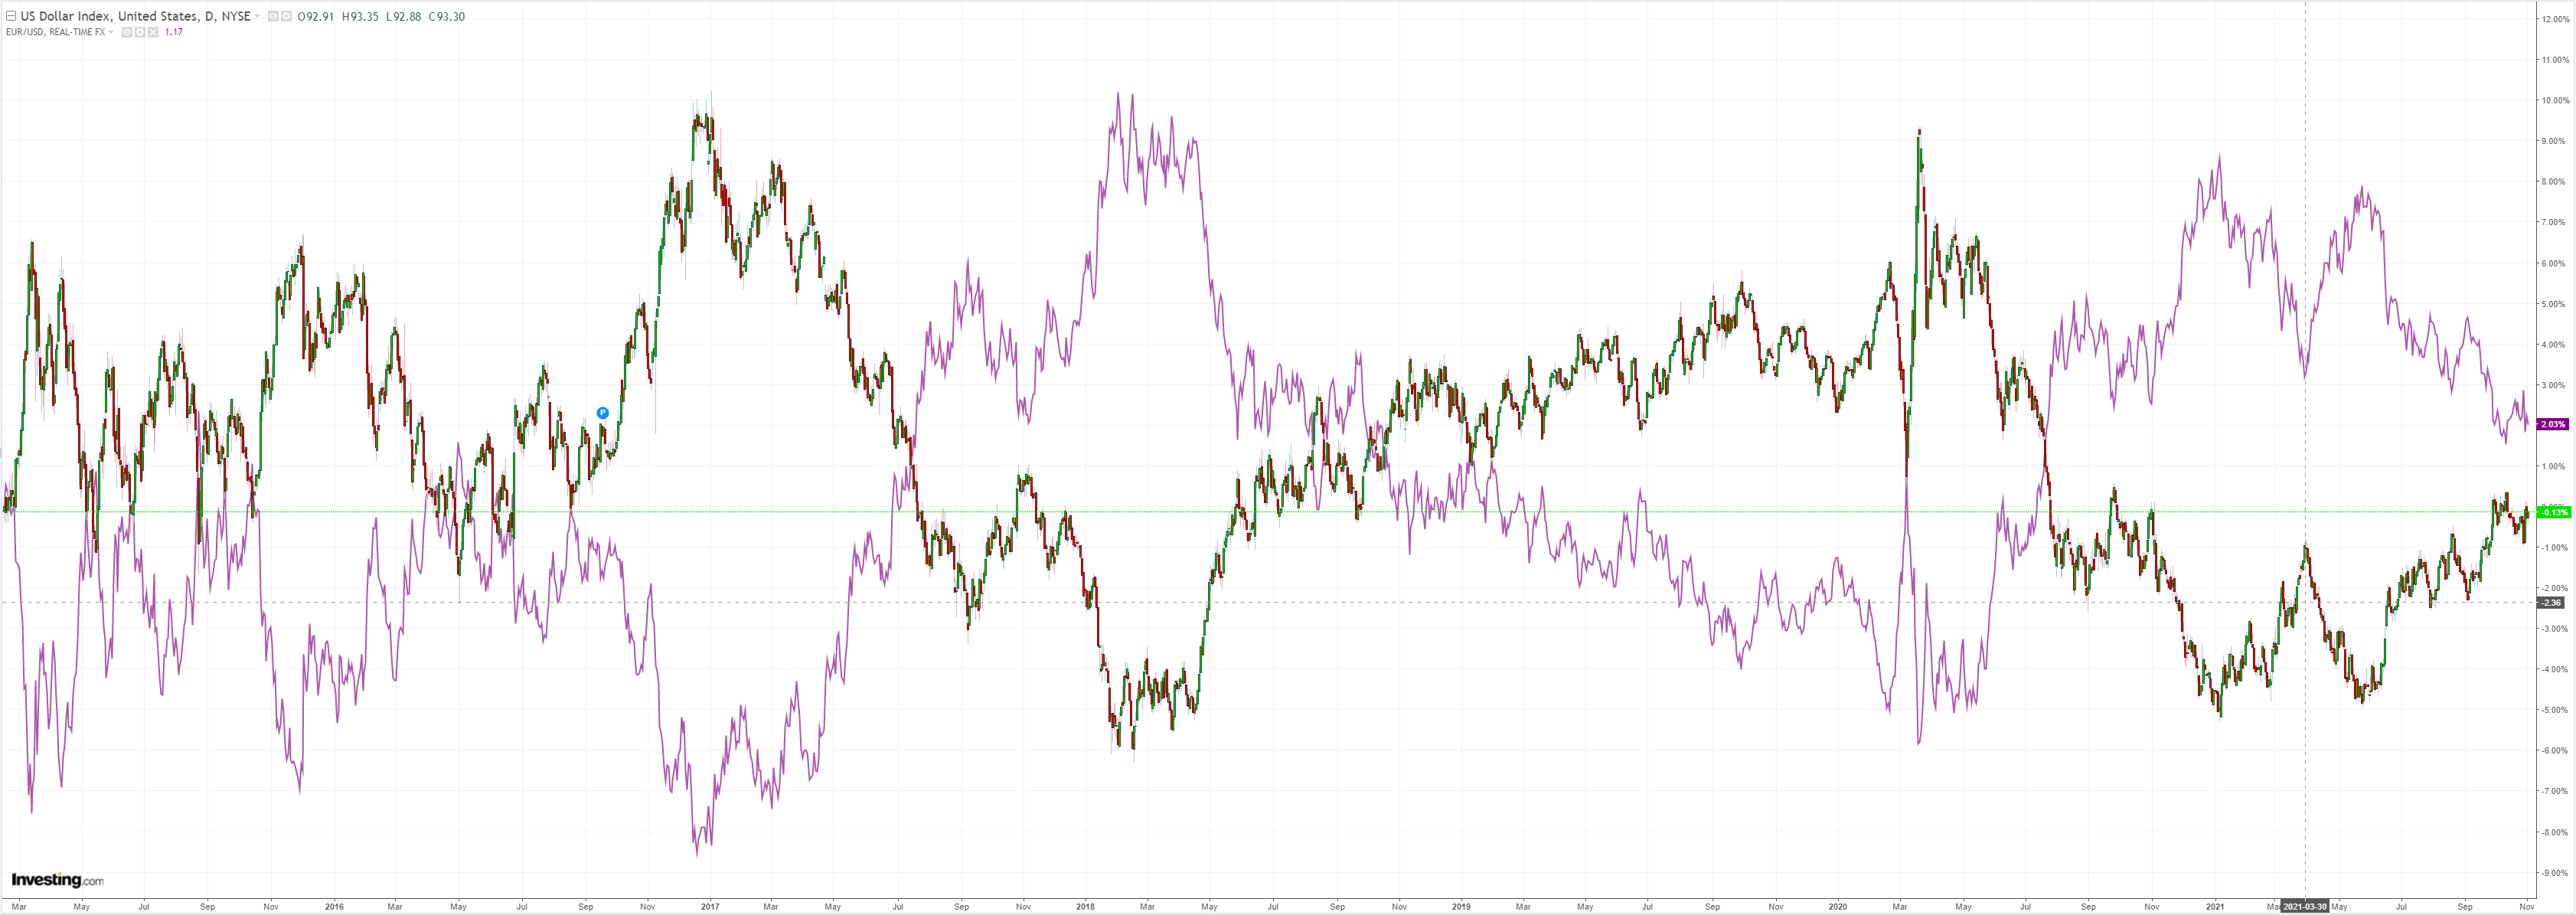
DXY was firm last night and EUR soft:


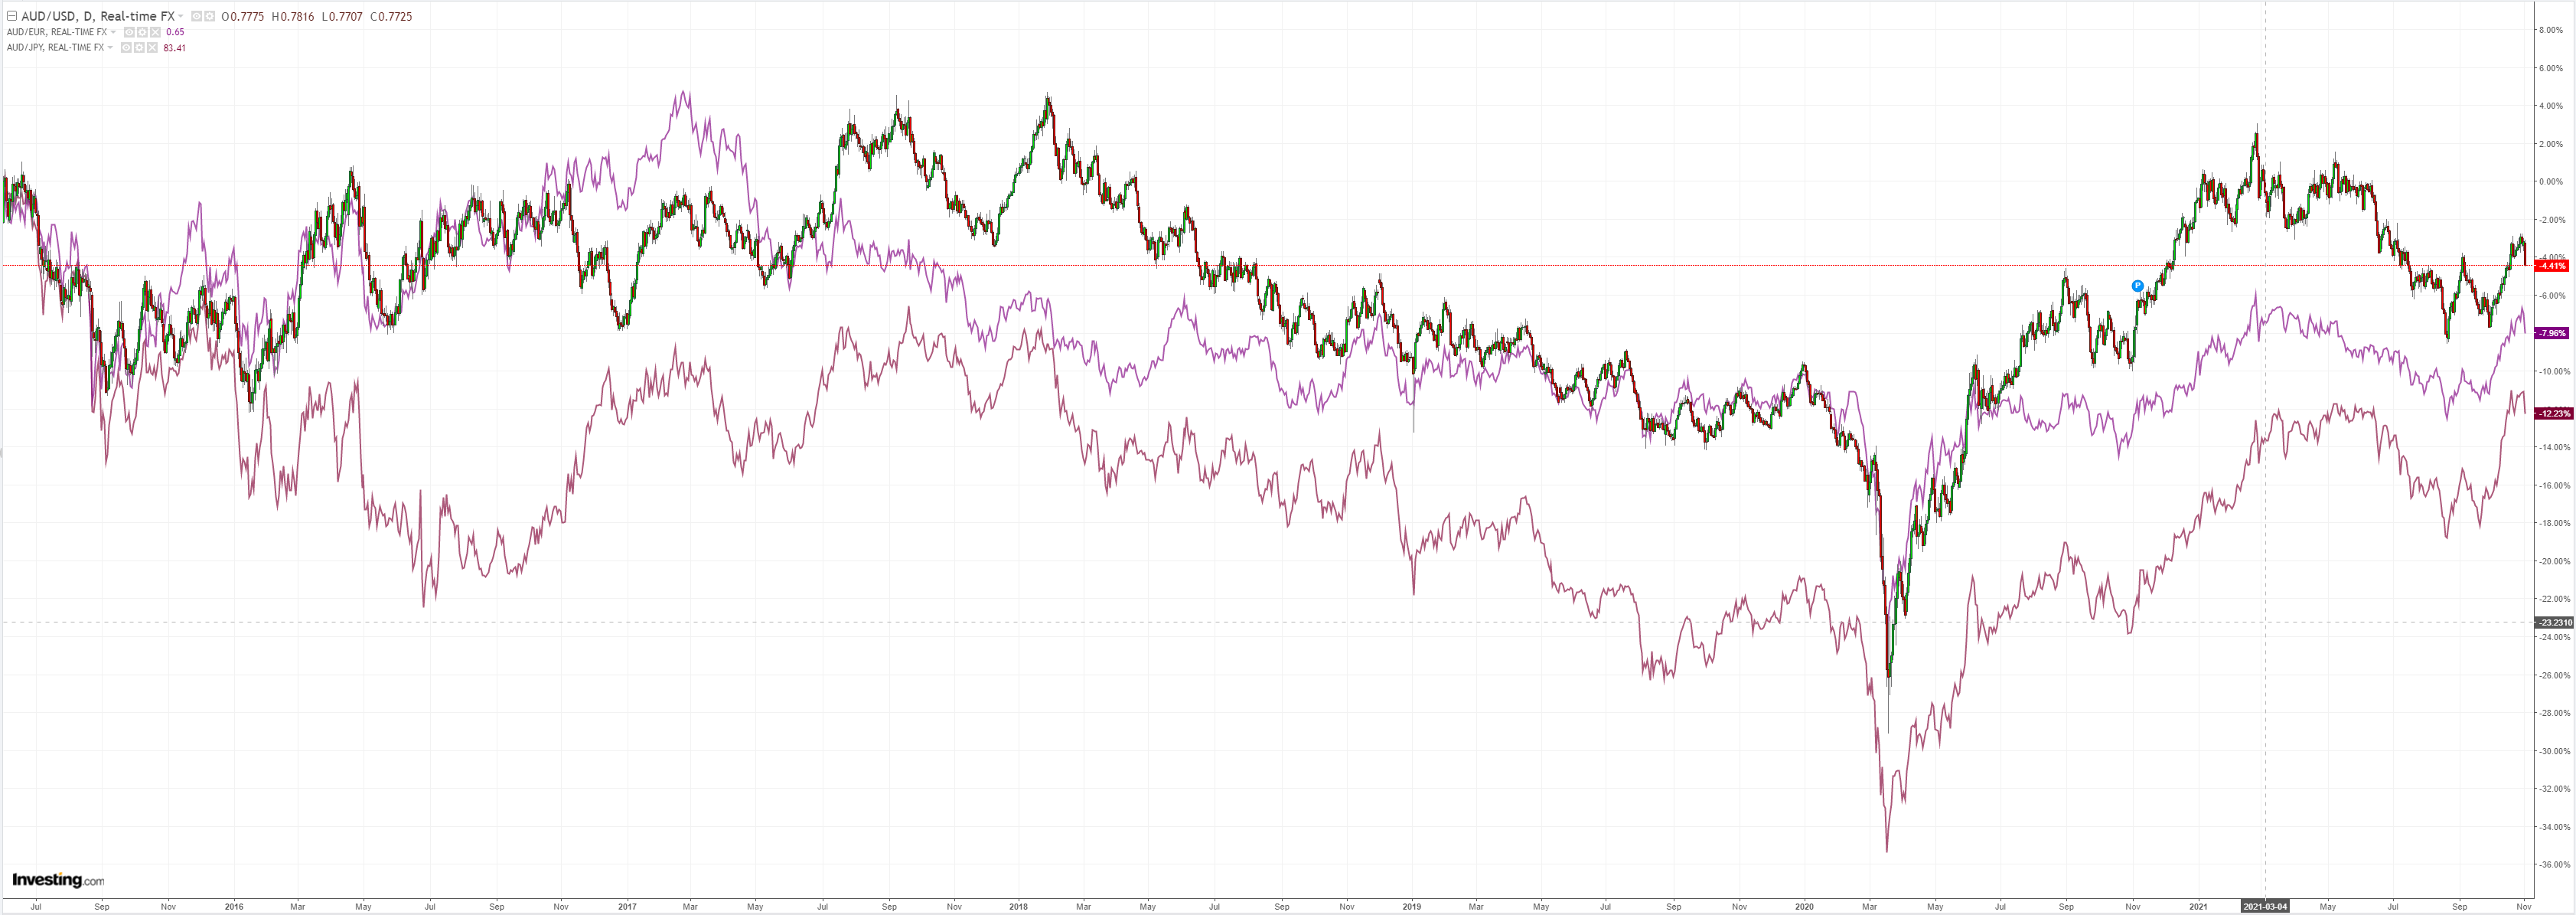
The Australian dollar puked lower:
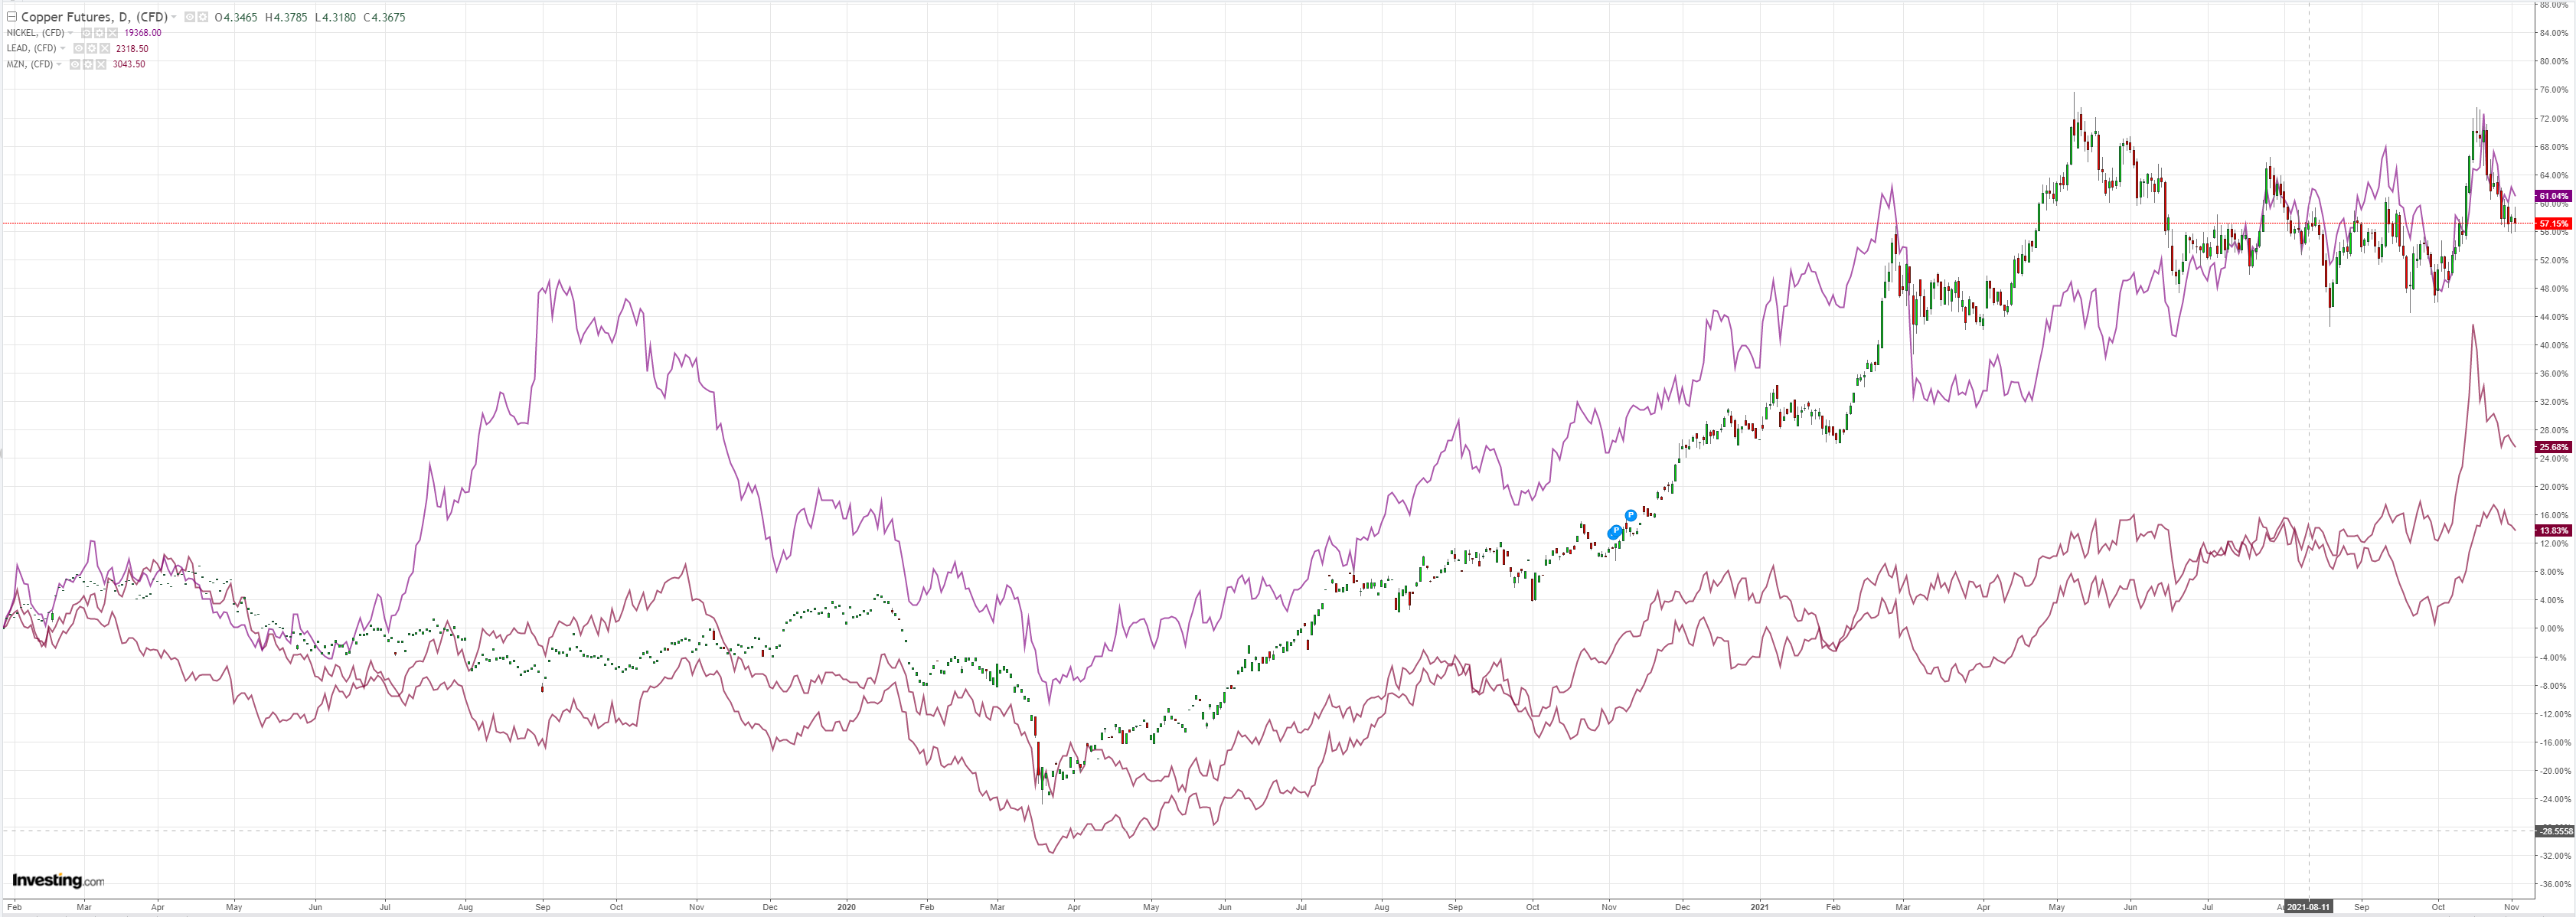
Oil and Gold did little:

Base metals eased:

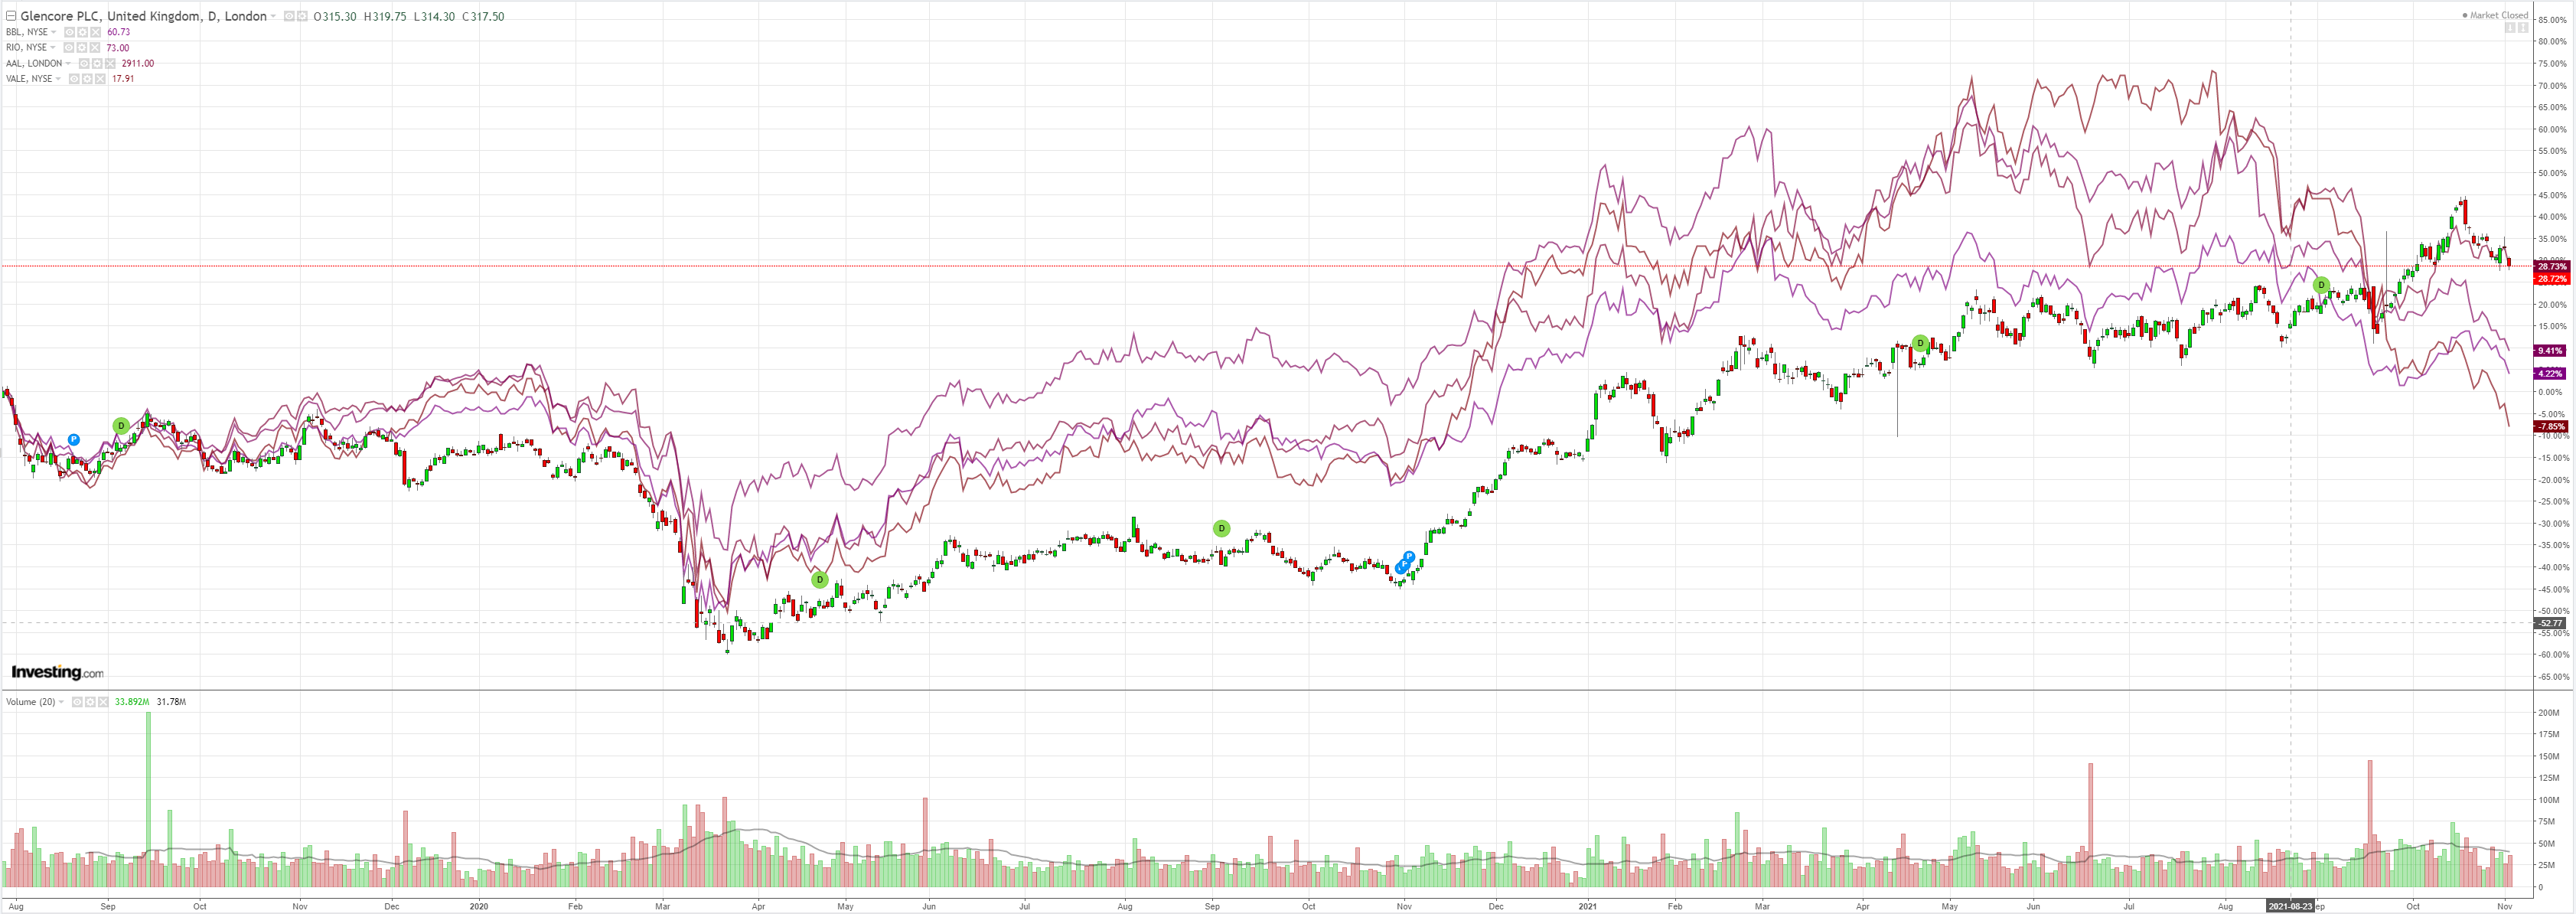
Big Iron is being flushed:

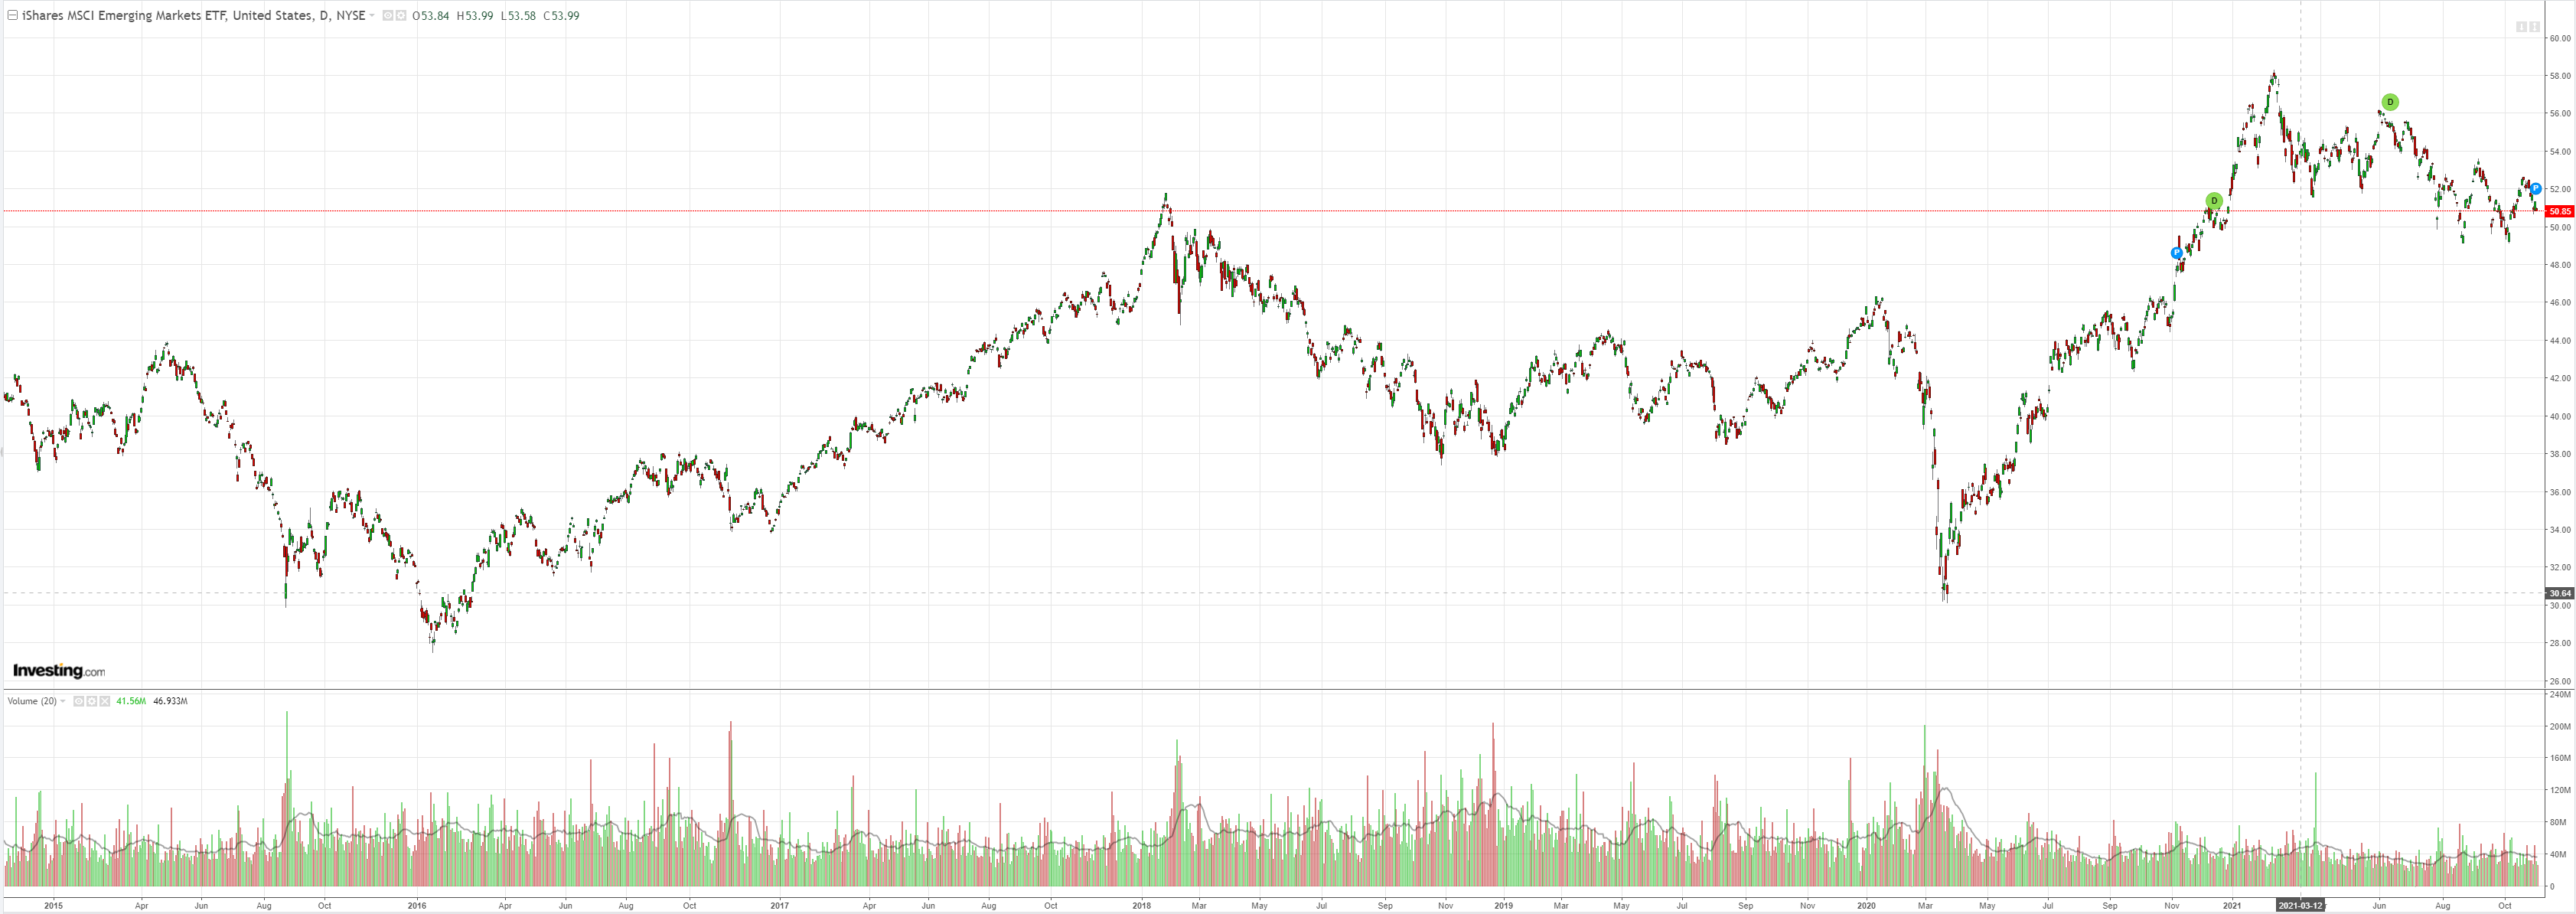
EM stocks still look sick:
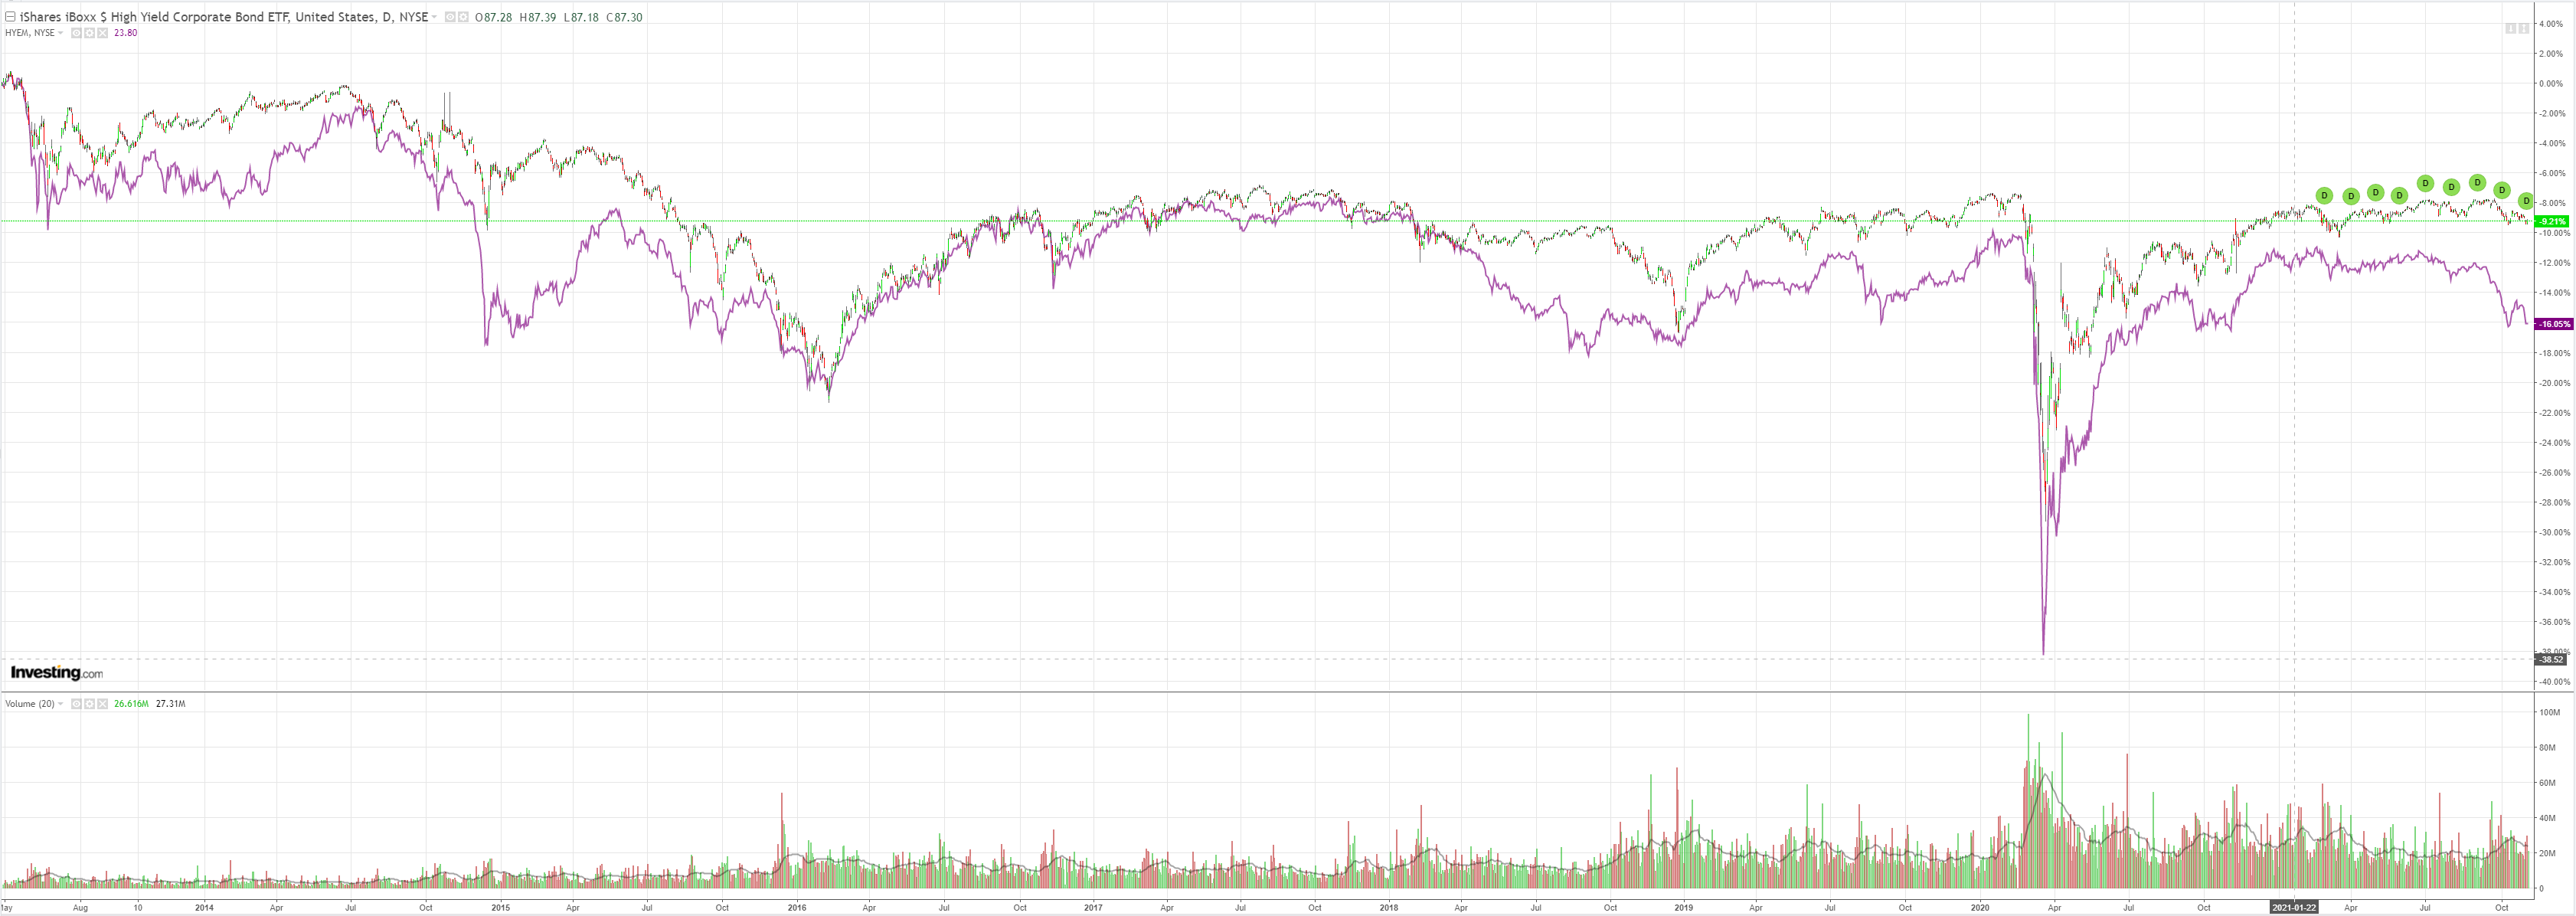
And junk:

Treasury yields fell away:

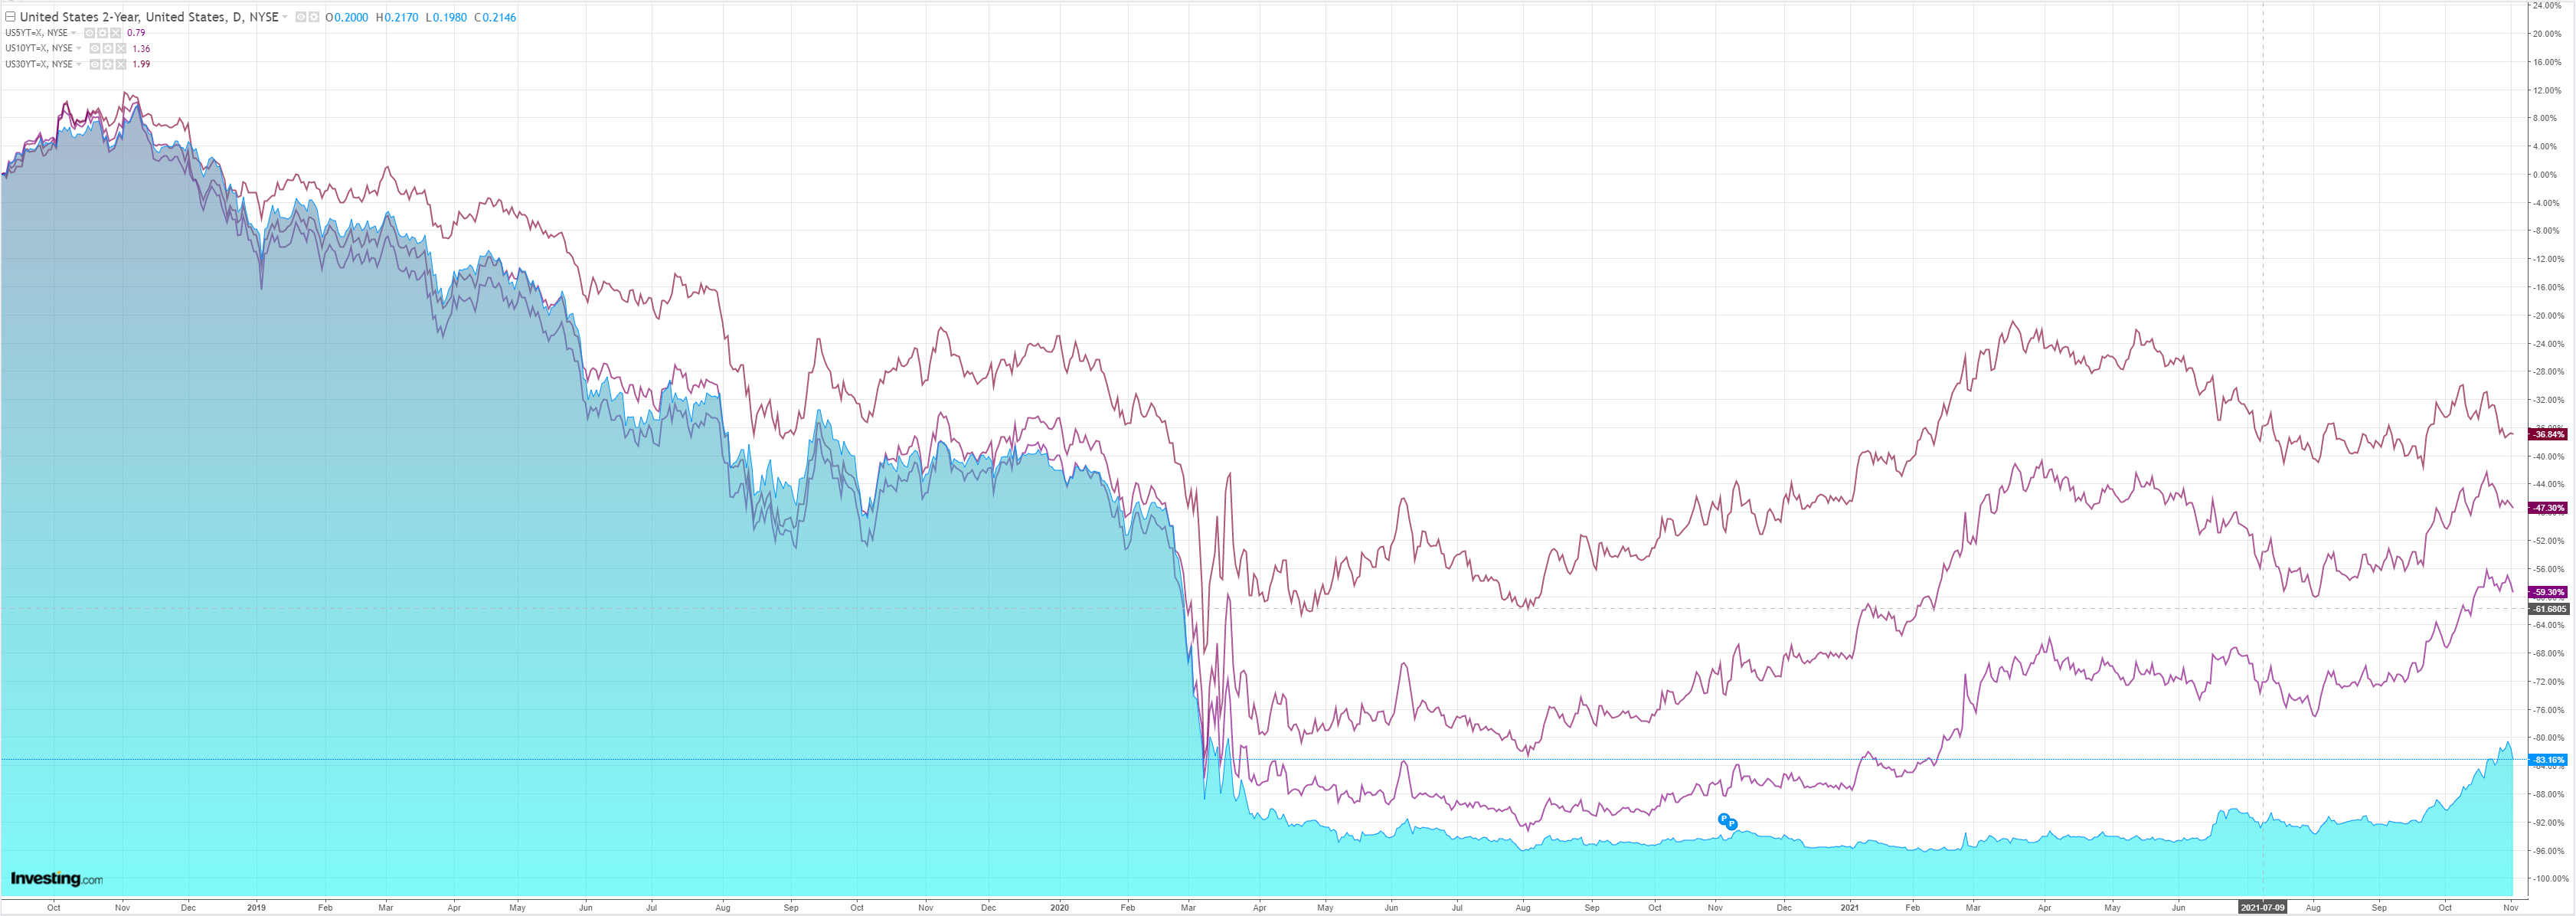
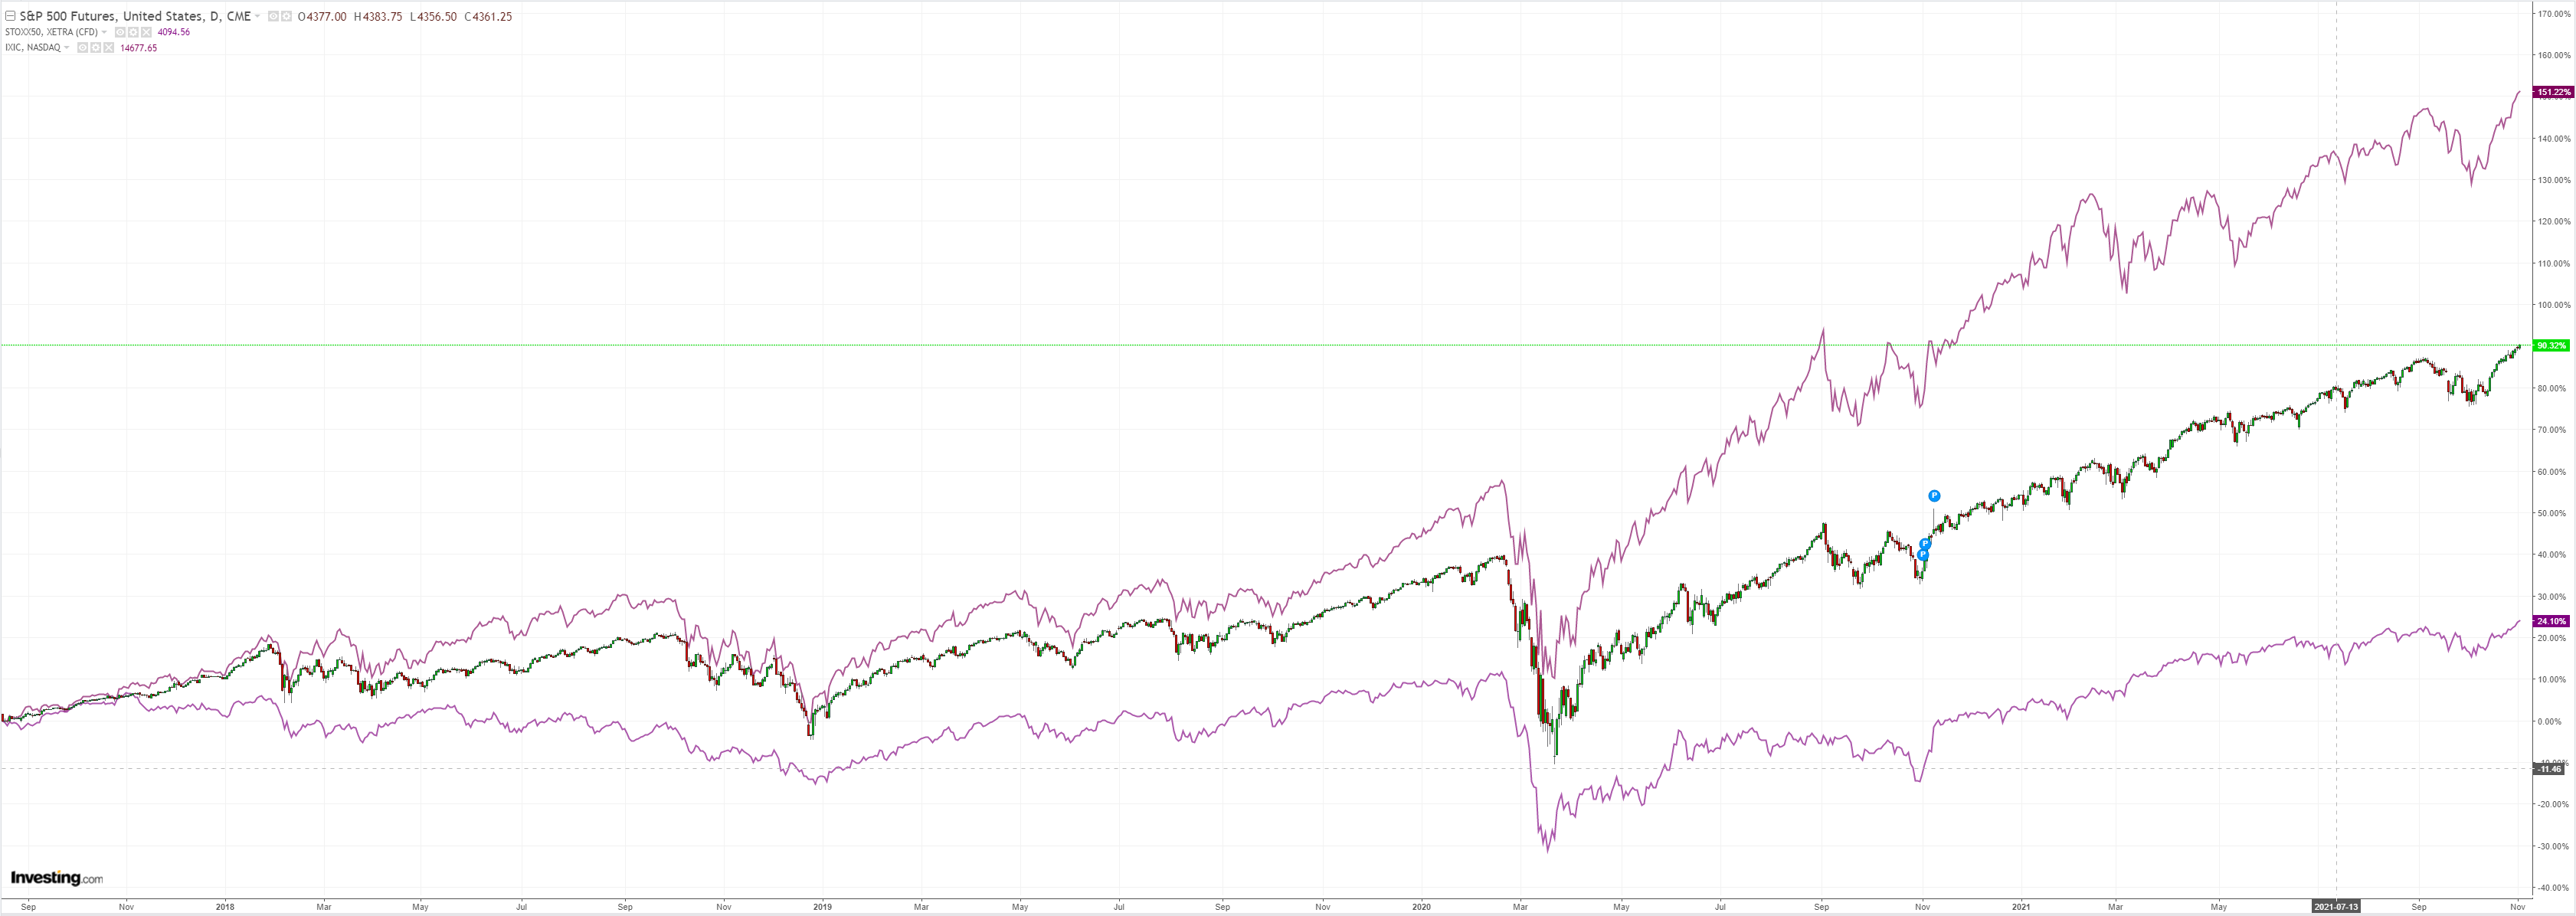
Which boosted, you guessed it, GAMMA:

Westpac has the wrap:

Event Wrap

Markit’s final Oct. Eurozone PMI was marked down slightly, to 58.3 from 58.3, with further emphasis on production activity being hampered by extreme supply and cost constraints.

Event Outlook

Aust: In September, dwelling approvals are expected to fall 8% as August’s gain from high-rise approvals reverses and HomeBuilder activity continues to unwind.

NZ: Strong employment indicators over recent months imply a robust employment result for Q3 (Westpac f/c: 0.8%); the unemployment rate is likely to again be distorted by Covid lockdowns (Westpac f/c: 3.8%). The Q3 labour cost index is also expected to highlight labour market tightness (Westpac f/c: 1.0%). The RBNZ Financial Stability Report is due as well.

Japan: The final release of the October Nikkei Japan services PMI should signal soft domestic demand.

China: The Caixin China services PMI is expected to pull back in October as delta risks escalate again (market f/c: 53.1).

Europe/UK: The Markit services PMIs for Europe and the UK will be the final release for the month. September’s Euro Area unemployment rate reportwill reflect continued recovery, while UK Nationwide house prices should see annual growth remain above 9% in October (market f/c: 0.3%).

US: October’s ISM non-manufacturing PMI and Markit services PMI should retain strength as reopening buoys activity and expectations. Another robust print for ADP employment change is anticipated in October (Westpac f/c: 400k). September factory orders however are expected to weaken on volatility in transport orders. The FOMC is expected to reveal a formal taper decision at its November meeting. We expect a reduction in purchases of $15bn per month from December 2021 to mid-2022.

In the context of little data, I think it fair to say that the RBA’s dovish commentary yesterday popped inflation overexcitement globally. Obviously that’s what hammered the AUD.

I remain of the view that it is right to be skeptical. Locally, inflation pressures are narrow and wage growth still terrible. Globally, the supply-side constraints of this year will ease as volumes fall back on softening goods consumption and the Chinese accident.

I especially like the look of this kind of thing (the magazine cover indicator):

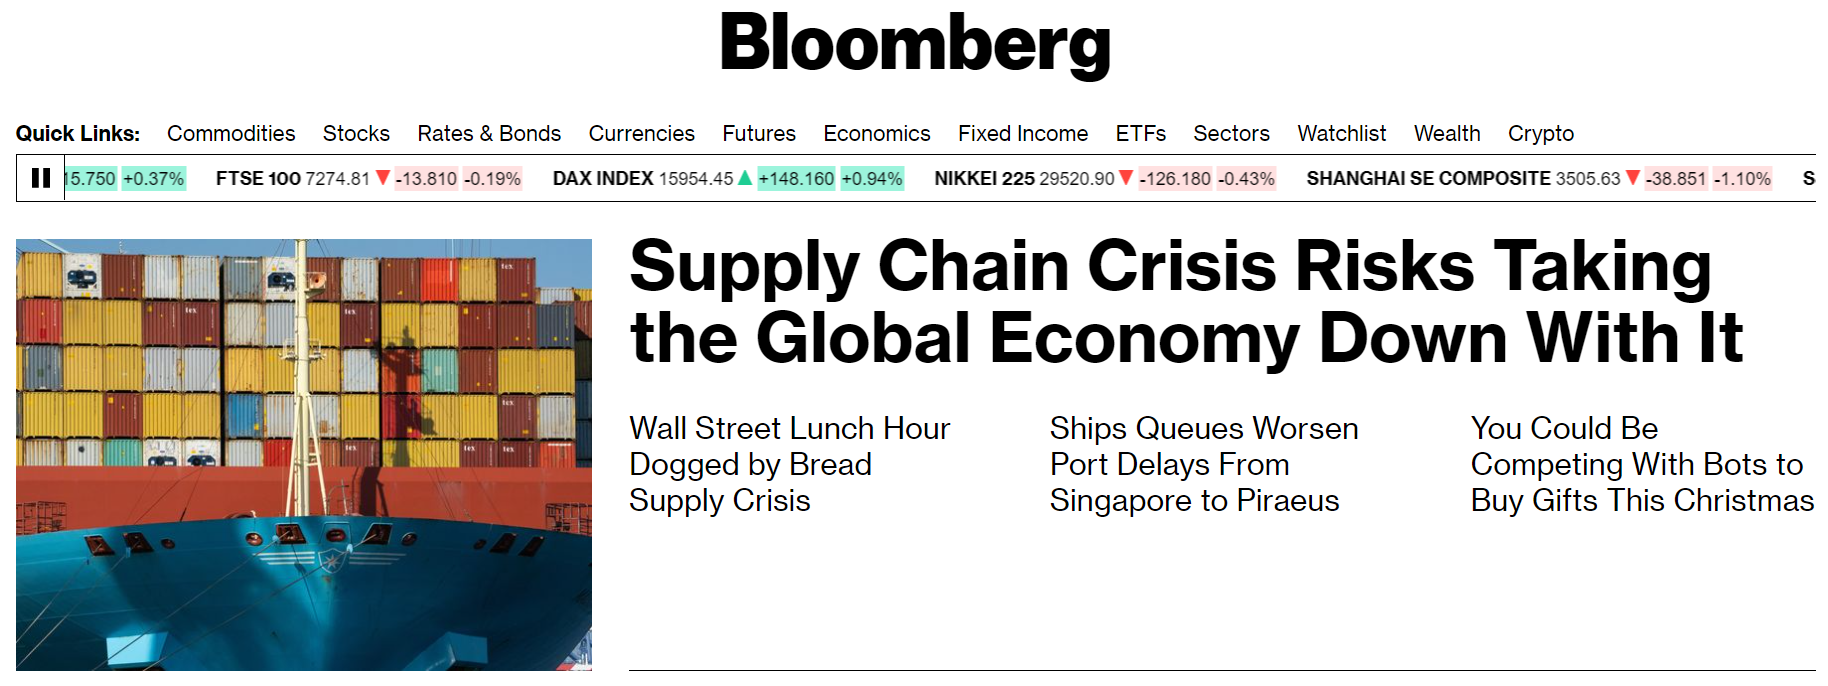
This comes with this chart:

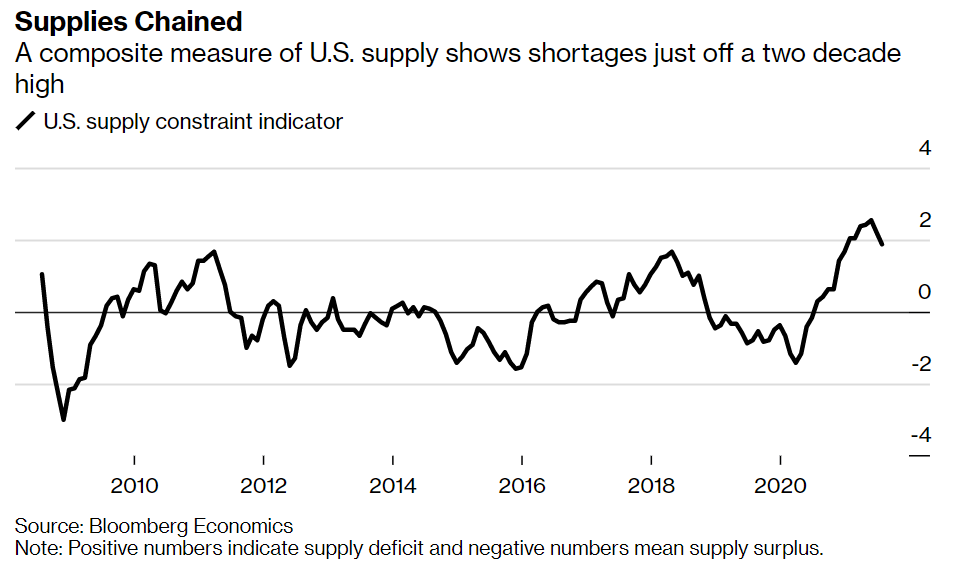
Next up, congested logistics like ports, shipping, containers and other transport are all going to unclog after the Christmas rush subsides.

All of these supply-side inflation pulses are temporary and should revert to pre-Covid prices the moment that bottlenecks clear. Which appear to converge around the new year and should ease throughout 2022.

The second factor driving global inflation is that markets fearing inflation have bid up commodity prices as a hedge.

This has, in turn, created more inflation as input prices rocket higher. But as the supply-side prices collapse that rationale will also fall away and those hoarding raw materials against a more expensive rainy day will panic sell.

Barring a new Chinese property stimulus, I can’t see any macro reason for ongoing AUD strength except a market drunk on a stagflation narrative.

But who knows when that ends!

Australian dollar thrashed as RBA pops inflation bubble
 

Related Articles

Australian dollar thrashed as RBA pops inflation bubble

Add a Comment

Comment Guidelines

We encourage you to use comments to engage with users, share your perspective and ask questions of authors and each other. However, in order to maintain the high level of discourse we’ve all come to value and expect, please keep the following criteria in mind: 

  • Enrich the conversation
  • Stay focused and on track. Only post material that’s relevant to the topic being discussed.
  • Be respectful. Even negative opinions can be framed positively and diplomatically.
  •  Use standard writing style. Include punctuation and upper and lower cases.
  • NOTE: Spam and/or promotional messages and links within a comment will be removed
  • Avoid profanity, slander or personal attacks directed at an author or another user.
  • Don’t Monopolize the Conversation. We appreciate passion and conviction, but we also believe strongly in giving everyone a chance to air their thoughts. Therefore, in addition to civil interaction, we expect commenters to offer their opinions succinctly and thoughtfully, but not so repeatedly that others are annoyed or offended. If we receive complaints about individuals who take over a thread or forum, we reserve the right to ban them from the site, without recourse.
  • Only English comments will be allowed.

Perpetrators of spam or abuse will be deleted from the site and prohibited from future registration at Investing.com’s discretion.

Write your thoughts here
 
Are you sure you want to delete this chart?
 
Post
Post also to:
 
Replace the attached chart with a new chart ?
1000
Your ability to comment is currently suspended due to negative user reports. Your status will be reviewed by our moderators.
Please wait a minute before you try to comment again.
Thanks for your comment. Please note that all comments are pending until approved by our moderators. It may therefore take some time before it appears on our website.
 
Are you sure you want to delete this chart?
 
Post
 
Replace the attached chart with a new chart ?
1000
Your ability to comment is currently suspended due to negative user reports. Your status will be reviewed by our moderators.
Please wait a minute before you try to comment again.
Add Chart to Comment
Confirm Block

Are you sure you want to block %USER_NAME%?

By doing so, you and %USER_NAME% will not be able to see any of each other's Investing.com's posts.

%USER_NAME% was successfully added to your Block List

Since you’ve just unblocked this person, you must wait 48 hours before renewing the block.

Report this comment

I feel that this comment is:

Comment flagged

Thank You!

Your report has been sent to our moderators for review
Continue with Apple
Continue with Google
or
Sign up with Email