The Australian dollar made news highs across the board:
Commodities were all over the place:
But big miners sagged with iron ore:
EM stocks jumped:
And junk is serene:
Despite curve steepening:
Stocks eased but were still led by Growth:
Westpac has the wrap:
Event Wrap
US MNI Chicago PMI fell more than expected to 66.9 (est. 68.0, prior 73.4). The most prominent factors in the survey were supply shortages, in both labour and goods, and backlogs (“highest since 1951”), causing production to falter. Prices paid rose to 93.9 – “the highest since 1979”. S&P CoreLogic house prices for June were in line with expectations, rising 1.8%m/m (est. 1.8%m/m), for an annual rate of 19.1%y/y.
Eurozone CPI inflation in August surprised to the upside, with headline readings of +0.4%m/m and 3.0%y/y (highest annual pace in a decade) against estimates of 0.2%m/m and 2.5%y/y (prior 2.2%y/y). Core CPI also rose, to 1.6%y/y (est. 1.5%y/y, prior +0.7%y/y).
Among other European data releases, German unemployment in August fell to 5.5% (est. 5.6%, prior revised to 5.6% from 5.7%), French consumer spending was soft in July at -2.2%m/m (est. +0.2%m/m), but French final Q2 GDP rose to +1.1%q/q from the initial reading of +0.9%q/q.
More ECB officials signalled QE tapering. Holzmann said that the central bank should discuss cutting back crisis support at next week’s meeting. Knot also indicated that the ECB can afford to reduce the PEPP programme, since financing conditions are now favourable. He said that the pandemic program is close to fulfilling its purpose, and the program could end as planned in March 2022. These comments follow earlier signals from Guindos and Lane regarding the possibility of a slight moderation in monthly purchases at next week’s meeting.
Event Outlook
Australian GDP is now expected to grow by only 0.1% in Q2, down from our preliminary forecast of 0.5%. To the revised view, risks appear tilted to the downside. Indeed, the expenditure measure of GDP is expected to contract 0.1% in Q2. The two other variants of GDP (production and income) should however see positive growth, holding up the average headline measure. Corelogic house prices for August are expected to print another strong gain despite disruptions related to the current lockdowns.
In China, Caixin’s August PMI will provide insight into the performance of small to mid-sized manufacturers. While the official NBS PMI (which focuses on large firms) held above 50 in August, signalling continued expansion, the Caixin measure is clearly at risk of dropping to a contractionary read as a result of disruptions to industry from the aggressive restrictions recently imposed to stop small outbreaks of delta within China.
In the US, the August ISM manufacturing survey will be the focus, particularly the price paid and employment sub-components. August ADP (NASDAQ:ADP) private payrolls will also be assessed as a guide to the skew of risks for Friday’s nonfarm payrolls release – this is despite ADP recently being a poor indicator of the official series. US construction spending for July is also due.
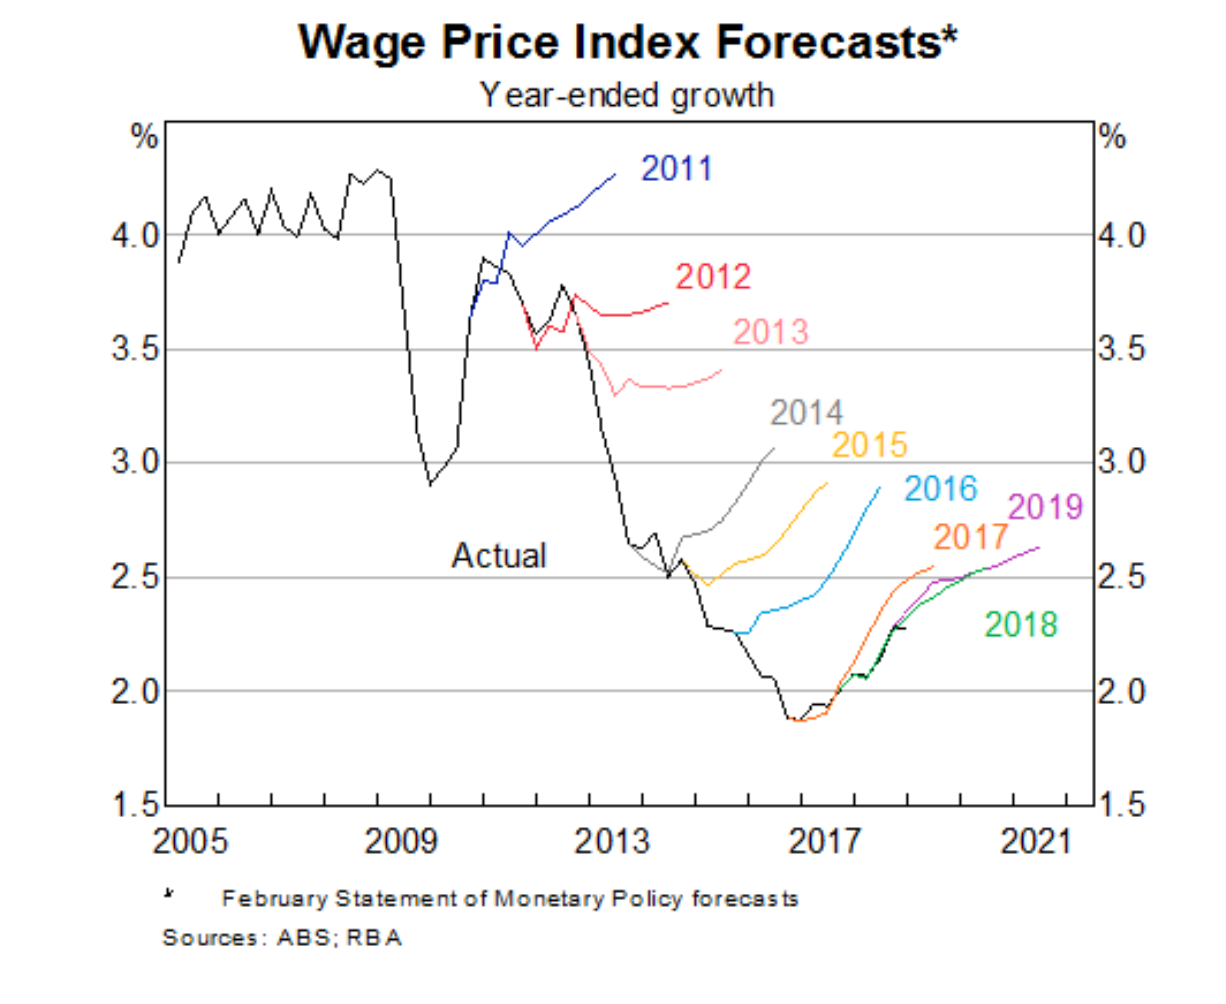
The Australian dollar took flight yesterday afternoon after the RBA released a new paper that modeled imminent wage inflation:
The way in which wages respond to very low rates of unemployment remains a key source of uncertainty in Australia, partly due to the lack of historical evidence to draw upon. To help fill this gap, we study data on unemployment rates and wages growth across local labour markets over the past 20 years. The considerable variation in economic conditions across local labour markets allows us to infer the strength of the relationship between unemployment and wages growth (i.e. the wage Phillips curve) at very low unemployment rates that are rarely seen at the national level. We find strong evidence that the wage Phillips curve is indeed a curve, rather than a straight line. When the unemployment rate exceeds 7½ per cent, the Phillips curve is flat and wages growth is unresponsive to changes in unemployment. Wages growth then becomes increasingly responsive to changes in the unemployment rate as the unemployment rate falls to lower and lower levels, most notably below 4 per cent. These findings have implications for monetary policy, particularly at the current juncture given the Reserve Bank of Australia’s central forecast for the unemployment rate to fall to multi-decade lows in the next few years.
I wonder what this rear vision mirror model has to say about the developing terms of trade shock. If we wait ten years it will be able to tell us.
In the meantime let’s look out the window at the analogous experience post-2012 which resulted directly in:
smashed nominal growth;
collapsing wages and inflation;
chronic underperformance of both for a decade.
Now, back to the model which says a wages explosion is imminent…
EUR/USD remains resilient after dipping below 1.05, hinting at a potential breakout.
Weak US data and stagflation fears fuel Fed rate cut bets, pressuring the dollar.
A break...
The US dollar has found a little support overnight after the House passed a budget blueprint bill laying the groundwork for President Trump's tax-cutting agenda. The focus on...
Trump said yesterday that tariffs on Mexico and Canada are still on the table ahead of next Monday’s deadline. Markets remain reluctant to price that in for now, and some soft US...
Australian Dollar Rises on RBA Hot Air
Add a Comment
Comment Guidelines
We encourage you to use comments to engage with users, share your perspective and ask questions of authors and each other. However, in order to maintain the high level of discourse we’ve all come to value and expect, please keep the following criteria in mind:
Enrichthe conversation
Stay focused and on track. Only post material that’s relevant to the topic being discussed.
Be respectful. Even negative opinions can be framed positively and diplomatically.
Use standard writing style. Include punctuation and upper and lower cases.
NOTE: Spam and/or promotional messages and links within a comment will be removed
Avoid profanity, slander or personal attacks directed at an author or another user.
Don’t Monopolize the Conversation. We appreciate passion and conviction, but we also believe strongly in giving everyone a chance to air their thoughts. Therefore, in addition to civil interaction, we expect commenters to offer their opinions succinctly and thoughtfully, but not so repeatedly that others are annoyed or offended. If we receive complaints about individuals who take over a thread or forum, we reserve the right to ban them from the site, without recourse.
Only English comments will be allowed.
Perpetrators of spam or abuse will be deleted from the site and prohibited from future registration at Investing.com’s discretion.
Your ability to comment is currently suspended due to negative user reports. Your status will be reviewed by our moderators.
Please wait a minute before you try to comment again.
Thanks for your comment. Please note that all comments are pending until approved by our moderators. It may therefore take some time before it appears on our website.


Add a Comment
We encourage you to use comments to engage with users, share your perspective and ask questions of authors and each other. However, in order to maintain the high level of discourse we’ve all come to value and expect, please keep the following criteria in mind:
Perpetrators of spam or abuse will be deleted from the site and prohibited from future registration at Investing.com’s discretion.