Get 40% Off
🚨 Volatile Markets? Find Hidden Gems for Serious OutperformanceFind Stocks Now

Aussie Approaching 15-Month Trendline

Published 12/07/2017, 02:29 pm
Updated 09/07/2023, 08:31 pm

This Great Graphic, made on Bloomberg, depicts the Australian dollar since April 2016. We drew in the trendline from that April high, through the November high and the March 2017 high. It nearly catches last month's high as well. It comes in now near $0.7725.
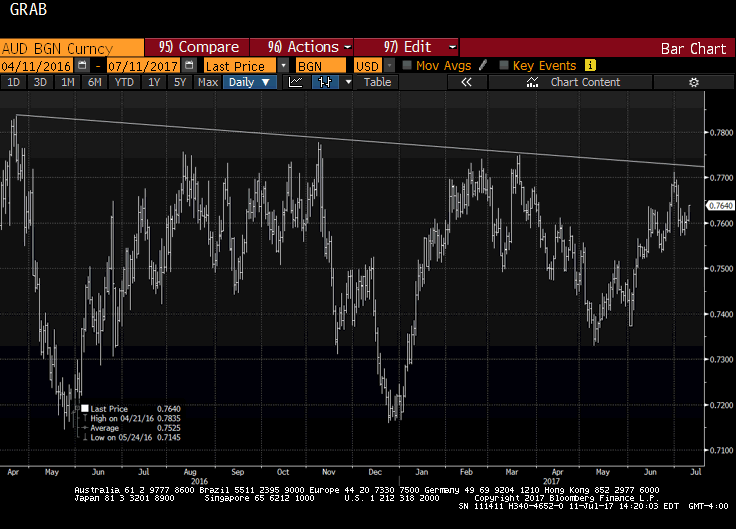
AUD BGN Daily

The technical tone is favorable with the RSI turning up, and the MACDs appear poised to cross higher, though not from oversold territory. The Slow Stochastics have turned down.

On the daily bar charts, the Australian dollar broke out of a small triangle pattern to the upside. The triangle pattern is most often thought of as a continuation pattern, but this breakout was in the opposite direction. In fairness triangles sometimes have false breaks, but this one looks real.

Unlike the Bank of Canada, which is widely expected to raise rates tomorrow, the Reserve Bank of Australia is not signaling a rate hike any time soon, and there are still many who think the next move can still be a cut. Although Australia reports consumer confidence and credit card use tomorrow, Thursday's consumer inflation expectations for July may be more important.

Inflation expectations began the year at 4.3%, the highest since May 2014. However, by June it had fallen to 3.6%, which is near last year's average expectation. A further fall could weigh on the Australian dollar.

The Aussie also looks attractive from a technical vantage point against the New Zealand dollar. It appears to be breaking out of a head and shoulders bottoming pattern and the technical indicators are showing bullish divergences with prices. A move above NZD1.06 can see NZD1.0750 (retracement objective and measuring objective of head and shoulders pattern).

3rd party Ad. Not an offer or recommendation by Investing.com. See disclosure here or remove ads .

Latest comments

Risk Disclosure: Trading in financial instruments and/or cryptocurrencies involves high risks including the risk of losing some, or all, of your investment amount, and may not be suitable for all investors. Prices of cryptocurrencies are extremely volatile and may be affected by external factors such as financial, regulatory or political events. Trading on margin increases the financial risks.
Before deciding to trade in financial instrument or cryptocurrencies you should be fully informed of the risks and costs associated with trading the financial markets, carefully consider your investment objectives, level of experience, and risk appetite, and seek professional advice where needed.
Fusion Media would like to remind you that the data contained in this website is not necessarily real-time nor accurate. The data and prices on the website are not necessarily provided by any market or exchange, but may be provided by market makers, and so prices may not be accurate and may differ from the actual price at any given market, meaning prices are indicative and not appropriate for trading purposes. Fusion Media and any provider of the data contained in this website will not accept liability for any loss or damage as a result of your trading, or your reliance on the information contained within this website.
It is prohibited to use, store, reproduce, display, modify, transmit or distribute the data contained in this website without the explicit prior written permission of Fusion Media and/or the data provider. All intellectual property rights are reserved by the providers and/or the exchange providing the data contained in this website.
Fusion Media may be compensated by the advertisers that appear on the website, based on your interaction with the advertisements or advertisers.
© 2007-2024 - Fusion Media Limited. All Rights Reserved.