Gold prices steady above $5k, silver surges after whipsaw week
Nearer term AUD outlook:
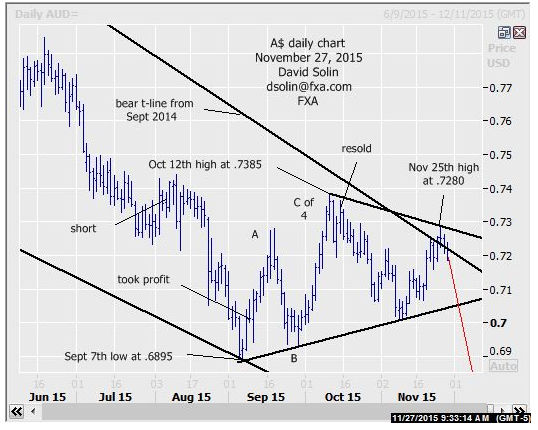
No change in the bigger picture, bearish view as the action from the Sept 7th low at .6895 is seen as a correction, and with eventual new lows after (see longer term below). Note too that the upmove from that low occurred in 3 waves (A-B-C, argues a correction), the action over that time has been sloppy/messy (characteristic of a correction) and the long held view of downside/potential final "washout" across a number of commodities (oil, copper, etc.) and commodity currencies (kiwi, gains in USD/CAD, etc.) into the mid/late Dec timeframe, all support this view. Though there is some risk for more ranging nearby, any such action would likely be limited (another week or so) before resuming that longer term decline. Nearby support is seen at .7145/55 and the bullish trendline from the Sept low (currently at .7030/45, potential down acceleration on a break). Nearby resistance is seen at .7275/90 (Nov 25th high, bearish trendline from the Oct 12th high). Bottom line : declines below the Sept low at .6895 still favored, with a resumption of those declines seen nearing.
Strategy/position:
Still short from the Oct 15th resell at .7335. For now would stop on a close 25 ticks above the bearish trendline from the Oct high and getting more aggressive on a break below that bullish trendline from Sept. Note had been using a close 25 ticks above that bearish trendline from Sept 2014. Though it recently traded just above, it never closed 25 ticks above.
Long term outlook:
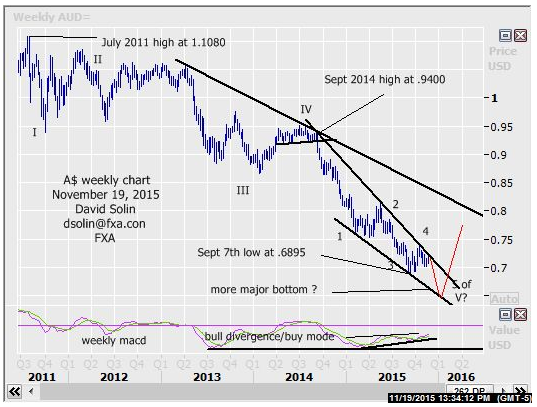
As discussed above, declines below that Sept .6895 low are still favored. However, the magnitude of the bigger picture downside below there may be limited and versus the start of a significant, new downleg as lots of long term positives are appearing. These long term positives include a very oversold market after the tumble from the Sept 2014 high at .9400 and technicals that did not confirm those Sept lows (see bullish divergence/buy mode on the weekly macd for example). Additionally, such a move below the Sept low would be seen as the final downleg in the decline from that the Sept 2014 high (wave 5) as well as the final downleg in the whole decline from the July 2011 high at 1.1080 (wave V). But as often discussed, these are just warning signs and at this point, don't to get too far ahead of ourselves as new lows below that Sept low at .6895 are still favored. Long term support below there is seen at the falling support line from last Feb/ceiling of the potential falling wedge pattern since Sept 2014 (currently at .6600/25) and would be an "ideal" area to form a more major bottom (see in red on weekly chart/2nd chart below). Bottom line : declines below .6895 favored, but magnitude of further big picture downside from there a question.
Strategy/position:
Also switched the longer term bias to the bearish side on Oct 15th at .7335. But with questions in regards to the magnitude of declines below .6895, will be looking to reassess the longer term picture on those new lows.
Current:
Nearer term : short Oct 15th at .7335, stop on close 25 ticks above the bear trendline from Oct 12th.
Last : short .7345 Aug 6, took profit Sept 9 above t-line from Aug (.7015, closed .7015, 330 tick).
Longer term: bearish bias Oct 2015 at .7335 but magnitude of declines below .6895 a question.
Last : bull bias May 14th to neutral May 19th below t-line from Apr (.7965, closed .7905).


