The RBA left rates unchanged as expected, but its tone was dovish. AUD looks shaky as we approach some major supports.
This was, in fact, the 2nd major piece of data for Australia today. Earlier in the morning, Australia posted its 2nd largest monthly trade surplus at 3.6 billion AUD. On the face of it, this should have been good news for the lucky country, but a casual dig into the make-up revealed that most of that was driven by plunging exports.
09:30 *(AU) AUSTRALIA FEB TRADE BALANCE (A$): +3.6B V +1.9BE (4TH CONSECUTIVE SURPLUS) – Imports m/m: -5.3% v +4.0% prior – Exports m/m: +1.5% v -3.0% prior – Source TradeTheNews.com
This had left the AUD looking heavy around the 7610 area leading into the RBA. The RBA left rates unchanged as expected, but their tone was decidedly dovish, most especially noting the softness in the employment market.
12:30 *(AU) RESERVE BANK OF AUSTRALIA (RBA) LEAVES CASH RATE TARGET UNCHANGED AT 1.50% (AS EXPECTED) Policy: – Source TradeTheNews.com Employment – ADDS some indicators of conditions in the labour market have softened recently. In particular, the unemployment rate has moved a little higher, and employment growth is modest. (PRIOR Labour market indicators continue to be mixed and there is considerable variation in employment outcomes across the country.)- REITERATES various forward-looking indicators still point to continued growth in employment over the period ahead. – ADDS Wage growth remains slow. – Source TradeTheNews.com
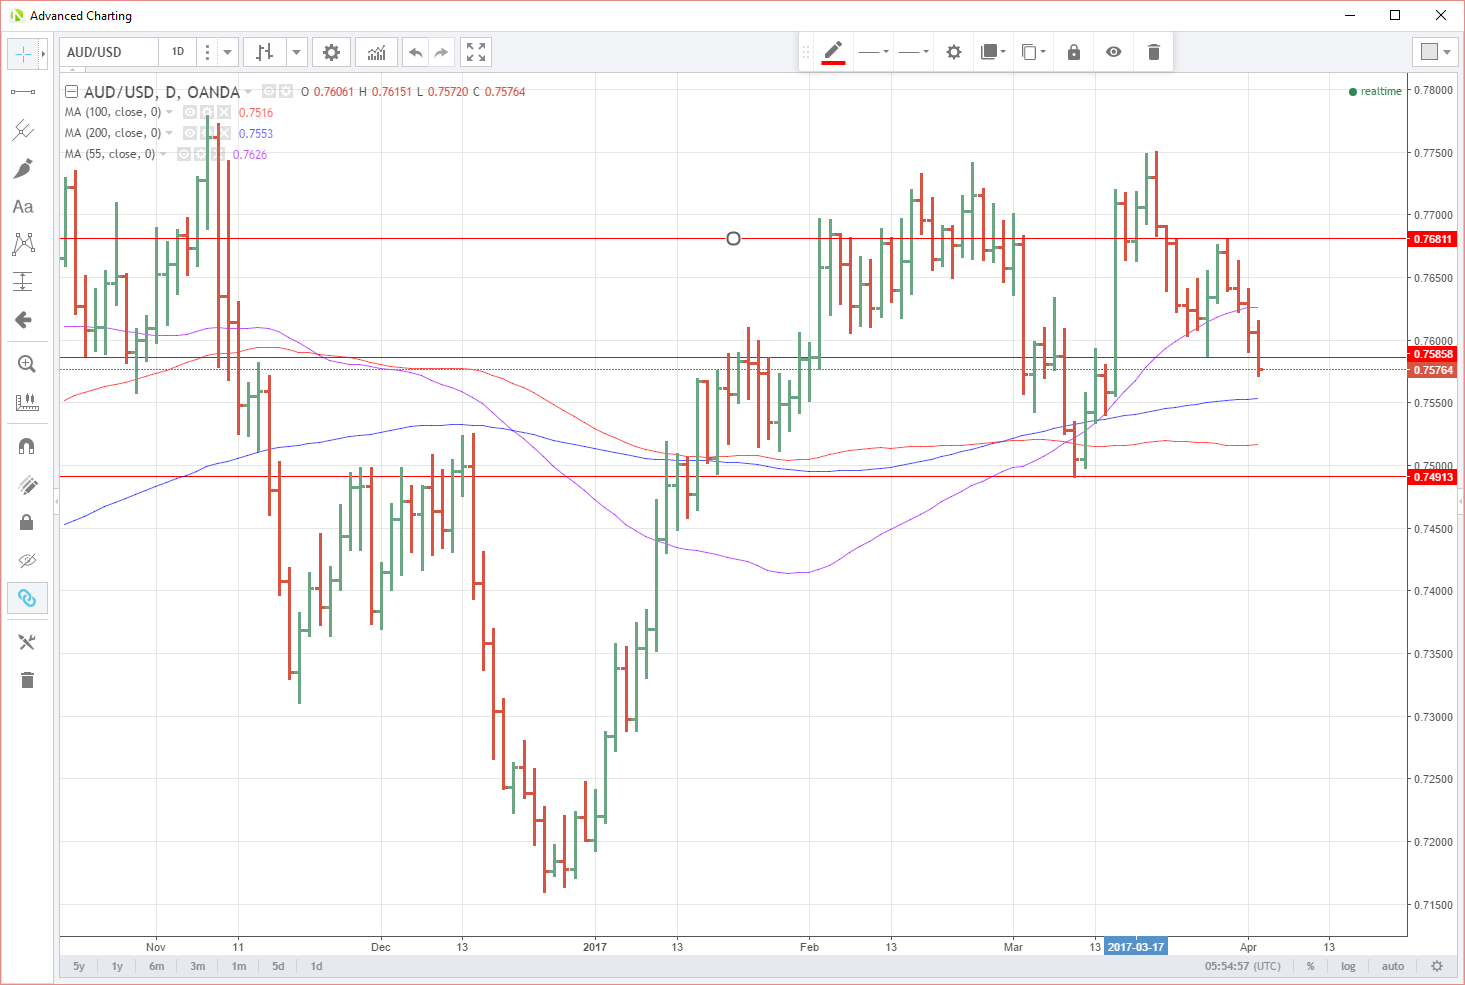
AUD was immediately marked lower to the 7585 area, the 28th March low and a support area. AUD has since continued its decline and is now showing technical signs it could be ready to test the lower end of its recent 7500/7750 2017 trading range.
The technicals, however, do show that AUD will have some wood to chop to achieve this. We have the 200 and 100-day moving averages at 7553 and 7516. We then have a double bottom at 7490; a daily close below would be a quite bearish technical indicator. Resistance now rests at 7585 initially, followed by 7680 and then 7750. 
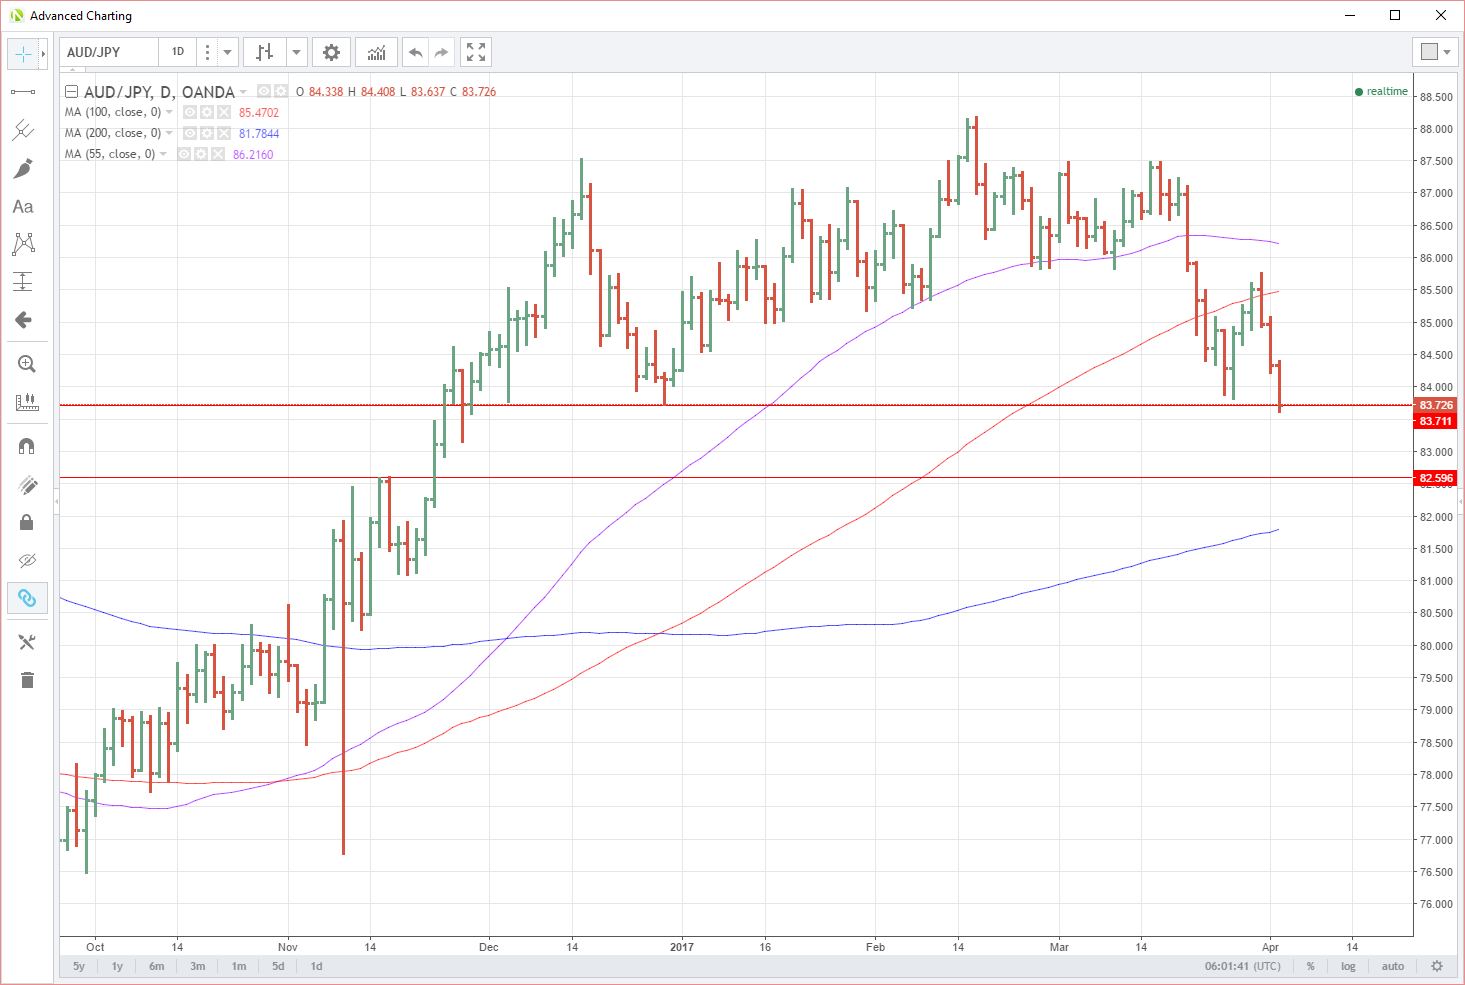
AUD/JPY Is also looking decidedly bearish on the charts as the cross tests must key support at the 83.70/75 area. This level has held numerous times going back to November, with a daily close below implying possibly much lower levels ahead. The next after this is 82.60. With USD/JPY also approaching its recent lows, this cross may be warning us that a breakout is imminent there as well.

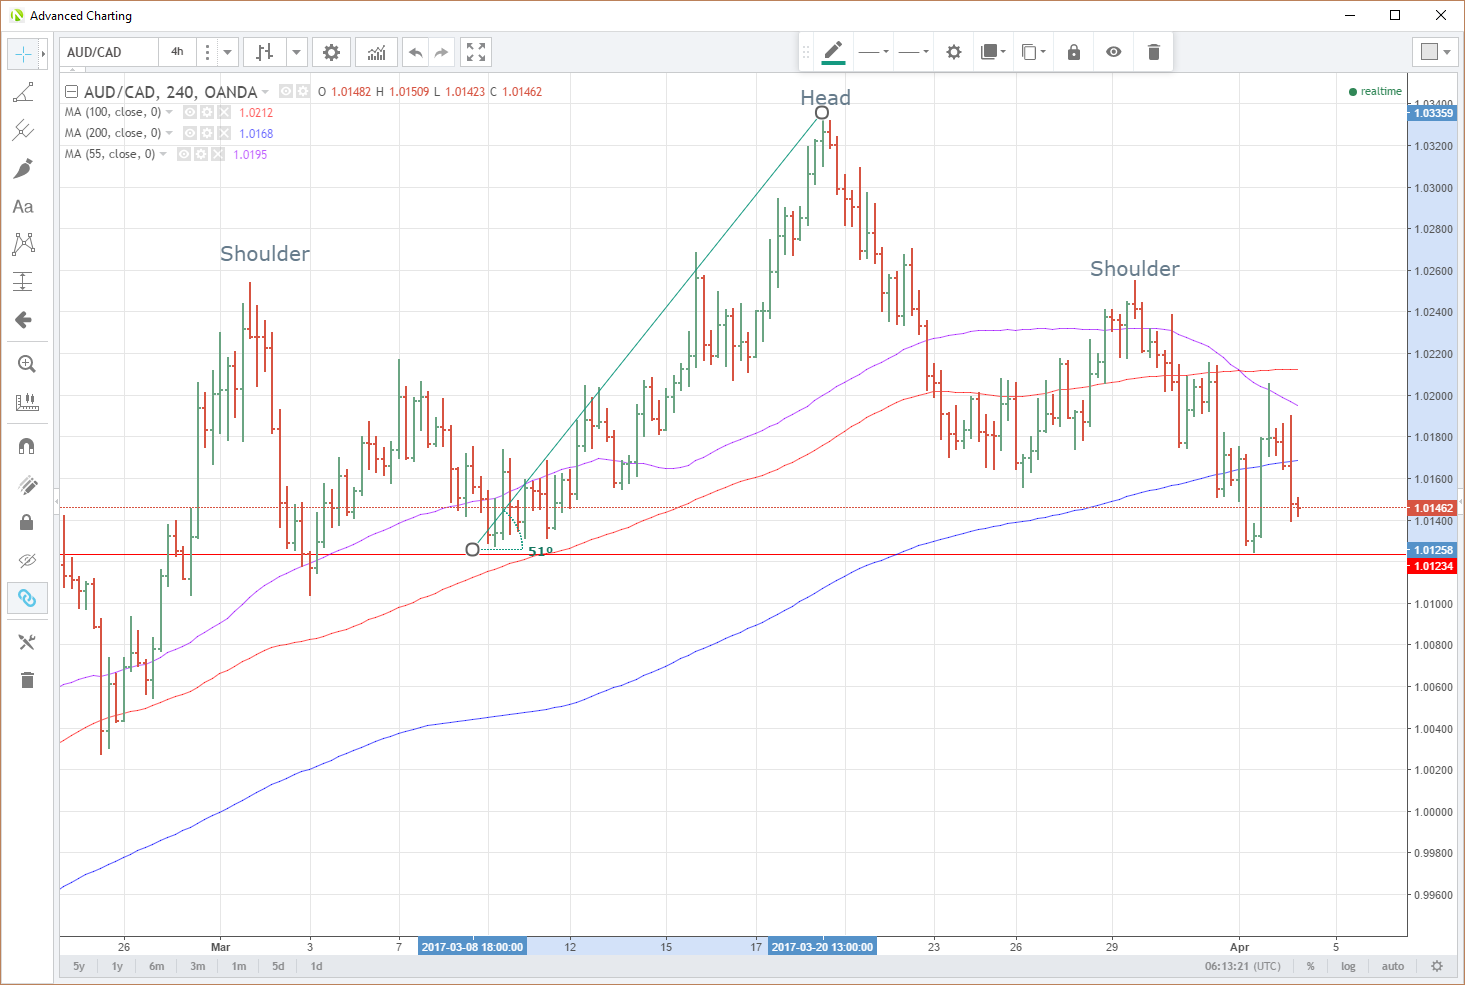
The 240-minute charts are not where I usually hunt, but they do nicely illustrate the head and shoulders pattern forming on AUD/CAD i9n the shorter term.
With a neckline around 1.0125 to the top of the head at 1.0335, this would imply a technical move of 210 pips to the 0.9915 area should the neckline make a firm break.

