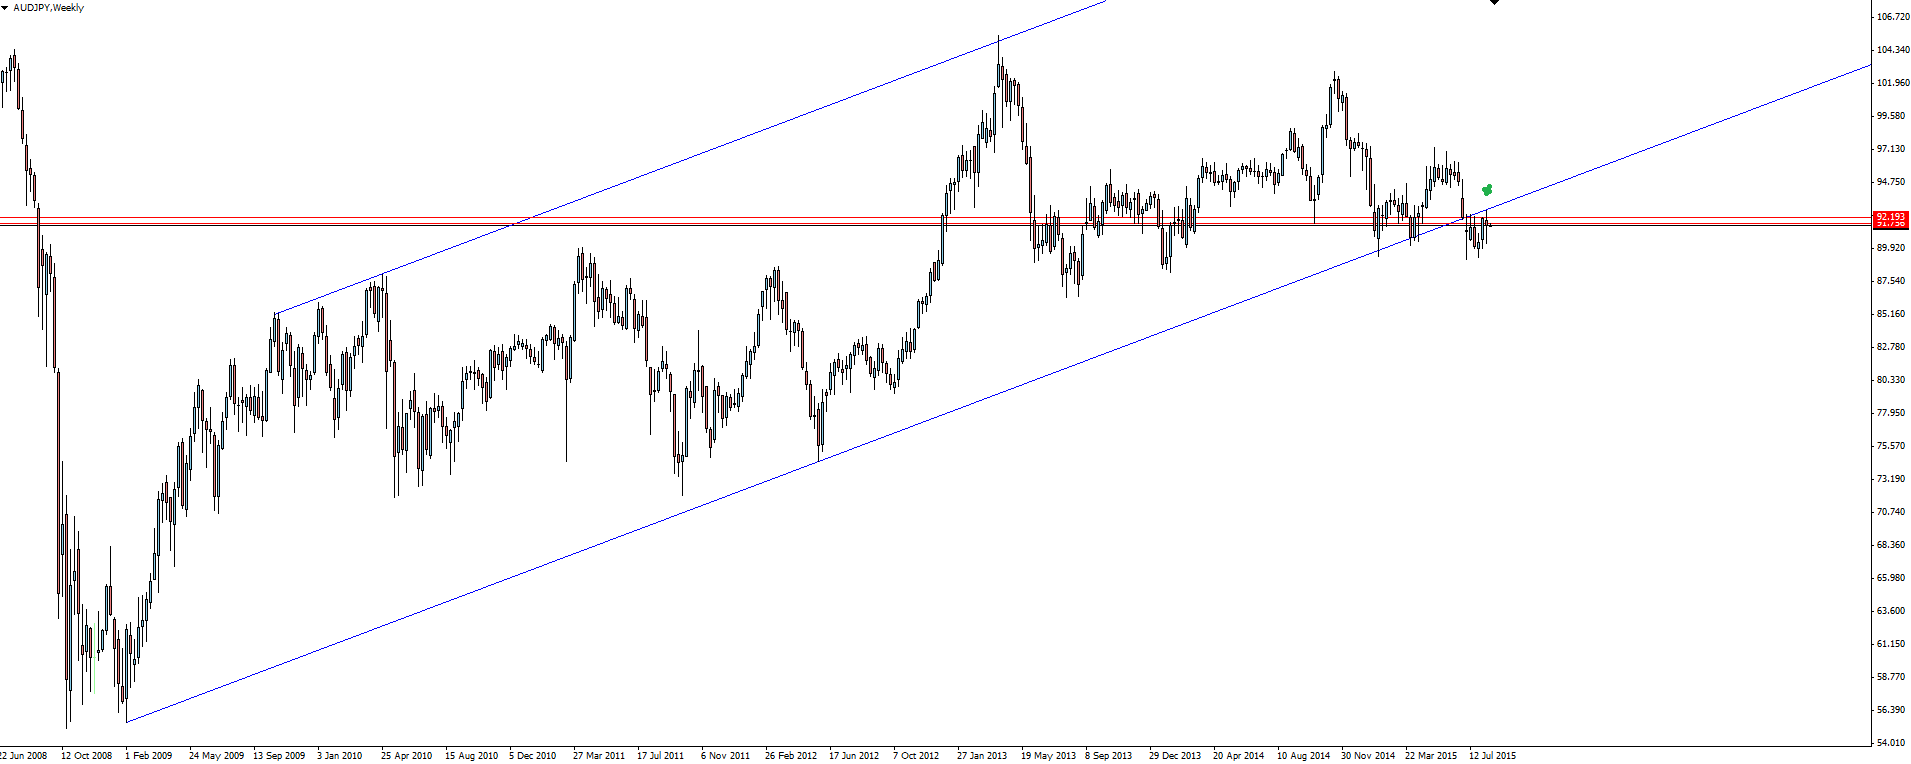
As we spoke about in this morning’s Daily Market Update, AUD/JPY is hanging precariously on for dear life after breaking major weekly trend line support.
AUD/JPY Weekly:
As you can see on the AUD/JPY weekly chart, price has broken the major weekly trend line support level that dates back as far as February 2009. Price has since then come back to perfectly re-test the broken support level now as possible resistance.
On the weekly chart, we also have this horizontal zone running through the trend line break. Just sitting back from your screen you can see how many touches of this zone we’ve had over the years with the big weekly doji rejection in 2014 standing out. I say this stands out because the strength of support/resistance levels isn’t just about the number of touches the zone receives, but most importantly how hard price then moves away from the level.
AUD/JPY 4 Hourly:
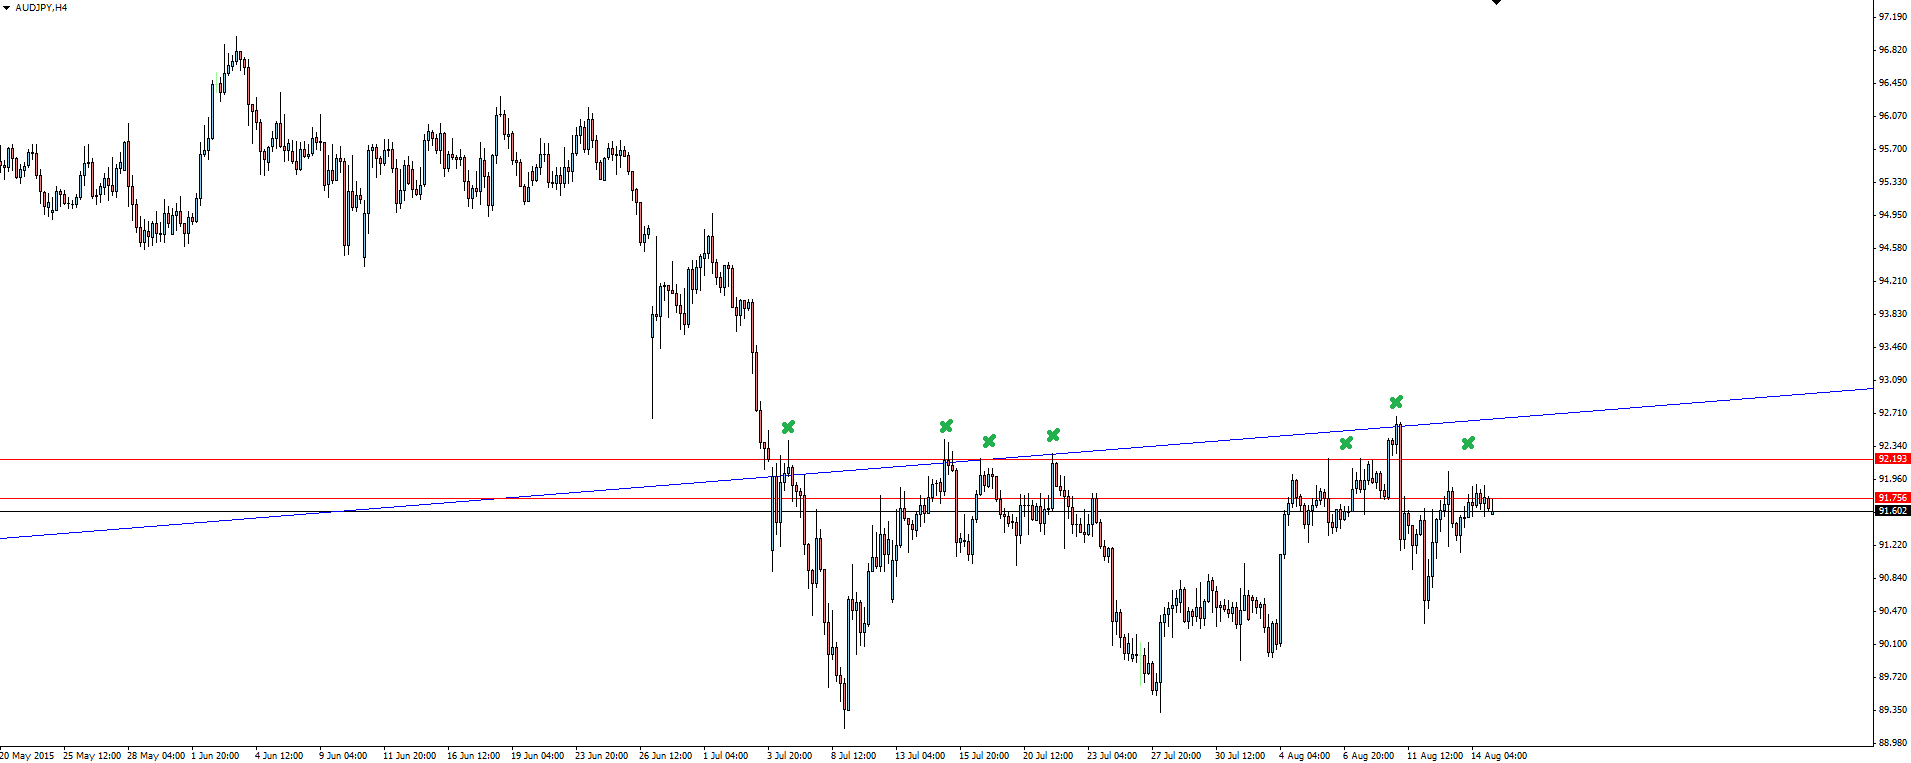
When we zoom into the 4 hourly chart, we can see the trend line break and re-test much clearer. What also jumps out at us on this chart is the sheer number of touches we have both on the underside of the trend line and also the horizontal zone we had marked from the weekly chart. Anywhere that a confluence of support/resistance lines up is an area of interest to us as traders.
On the @VantageFX Twitter (NYSE:TWTR) account we have been talking about shorting this re-test for a few weeks now, with the day traders happily banking some pips with each push off the level. However, the fact that each of the 3 previous pushes off the level have been unable to make a new lower low tells us that the sellers are running out of power. With each touch of the line and subsequent higher low, the sellers are being soaked up by the buyers. When there are no sellers left to be soaked up, price only has one way to go, and that’s up.
Risk Disclosure: In addition to the website disclaimer below, the material on this page prepared by Vantage FX Pty Ltd, does not contain a record of our trading prices, or an offer of, or solicitation for, a transaction in any financial instrument. The research contained in this report should not be construed as a solicitation to trade. All opinions, news, research, analyses, prices or other information is provided as general market commentary and marketing communication – not as investment advice. Consequently any person acting on it does so entirely at their own risk. The experts writers express their personal opinions and will not assume any responsibility whatsoever for the actions of the reader. We always aim for maximum accuracy and timeliness and Vantage FX shall not be liable for any loss or damage, consequential or otherwise, which may arise from the use or reliance on the service and its content, inaccurate information or typos. No representation is being made that any results discussed within the report will be achieved, and past performance is not indicative of future performance.
