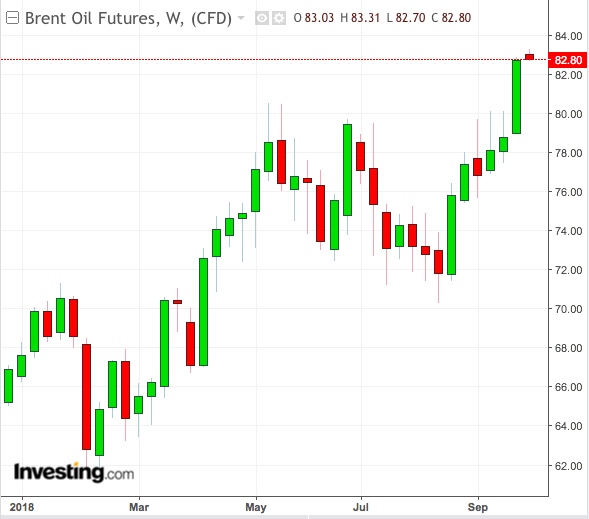
Brent is likely to forge highs nearer $85 a barrel this week, pulling US crude along in a broad rally, as fears over upcoming sanctions on Iran ensure no imminent end to the bull run in oil.

September’s run-up of nearly 6 percent was Brent’s largest jump this year. The UK-traded global crude benchmark rallied to $83.39 a barrel, its highest level since November 2014. US West Texas Intermediate (WTI) crude, meanwhile, leaped nearly 5 percent on the month to $73.25, a peak since July 11.
Investing.com’s daily technical outlook has a “Strong Buy” on both Brent and WTI, with no immediate sell targets. Brent has so far blown past the median forecast of $74 a barrel for the third quarter from a July Thomson Reuters poll of oil analysts. WTI has also surpassed the median of $69 given for US crude in that poll.
New Nuclear Accord Needed To Stop Oil’s Stampede
With just a month left to the start of new US sanctions on Iranian oil exports that could remove up to 1.5 million barrels per day from the global market, analysts say there is little to halt the upward momentum in both Brent and WTI, save for a deal between Tehran and Washington.
The sanctions are the Trump administration’s way of forcing Iran, the fourth largest exporter in the Organization of the Petroleum Exporting Countries (OPEC) with a capacity to ship up to 2.6 million barrels daily, to negotiate a new nuclear accord with the United States following the cancelation earlier this year of an Obama-era agreement.
“The bullish view is still the predominant market sentiment,” Dominick Chirichella, managing director for trading and risk management at the Energy Management Institute in New York, said at the weekend, referring to the likely path for oil prices through October. He, however, adds:
“This said, the most significant bearish variable/unknown (at this time) that could significantly derail the upward momentum in prices would be the US and Iran coming to the table to hash out revisions to the (previous) nuclear deal. This would result in a very quick and strong drop in prices … between $5 and $10 a barrel, or more.”
NatGas On Investors’ Radar As $3 Highs Persist
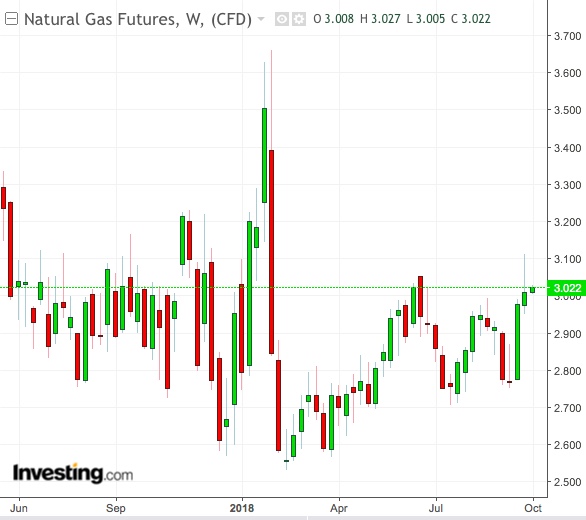
Natural gas will be another energy market on traders’ radar this week as extraordinary demand continues to defy seasonal trends in keeping the power generation fuel at above $3 highs.
In one of the most remarkable scripts playing out on the smallest energy market in the United States, output and stockpile numbers are at odds with each other.
Analysts said prospects for natural gas would be bearish from just its record high production, which the US Energy Information Administration expects to reach 81.34 billion cubic feet per day this year from 73.57 bcfd in 2017.
But the picture turns bullish if one was to consider pre-winter heating stockpiles, which were at one of their lowest in years due to unusually high volumes of gas burnt by utilities this summer to feed power demand for air conditioning. EIA data showed working gas in storage totals 2,768 billion cubic feet versus the five-year historical range of 3,389 bcf typical for this time of year.

Natural gas hit 14-month highs of $3.111 per million British thermal units in New York trading last week, before settling up about 4 percent for September. Investing.com’s daily technical outlook has a “Strong Buy” on natural gas, with no meaningful sell targets for now.
“Strong Sell” On Gold, Copper May Stabilize
Gold could seek a sharply lower support beneath $1,200 if the dollar starts rallying again on Fed expectations of another rate hike in December, which would be the fourth for the year.
The Fed added a quarter percentage point on Wednesday to bring U.S. interest rates to 2.25%. The central bank said it foresaw another increase in December, followed by three more in 2019 and one in 2020.
The “combination (of a) more hawkish Fed, inflation in check, rising yields and the greenback should be bearish for the gold prices,” said Arkadiusz Sieron, precious metals analyst at Sunshine Profits.
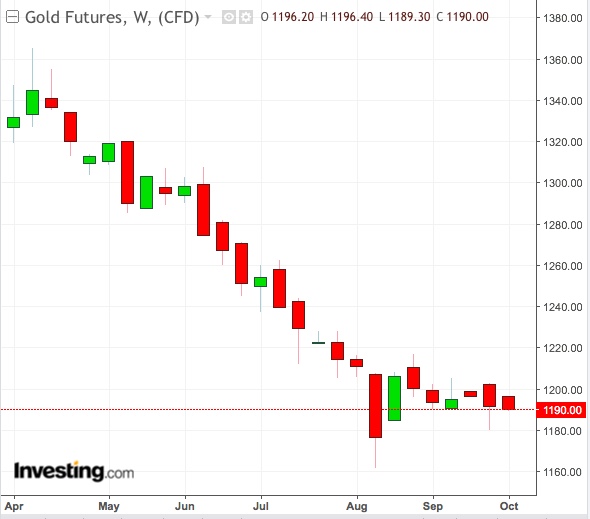
In Friday’s session, gold futures rebounded from a six-week low, settling at $1,196.20 per troy ounce. But that didn’t stop it from ending September down 1.6 percent, for its sixth straight monthly drop and the longest losing streak since January 1997.

Investing.com’s daily technical outlook has a “Strong Sell” for the yellow metal, with Fibonacci patterns setting the first major support at $1,180.28, second at $1,176.32 and third at $1,169.90.
The dollar is expected to take its cue this week from monthly US manufacturing PMI numbers due on Monday, and Friday’s nonfarm payrolls that will reveal how the US labor market performed in September.
On the base metals front, copper futures in New York might steady at $2.75 per lb, with US data showing that fund managers added to net longs during the week to Sept 25, after the Trump administration’s latest tariffs on China turned out to be less impactful than expected.
Investing.com’s daily technical outlook has a “Strong Buy” on copper futures, with Fibonacci patterns setting the first major resistance at $2.790, second at $2.802 and third at $2.820.
