This post was written exclusively for Investing.com
The S&P 500 may not be the only index that seems on the verge of a massive break out. The iShares MSCI ACWI ETF (NASDAQ:ACWX), which is a proxy for the MSCI ACWI Index, appears to be on the cusp of a big break out of its own. The ETF topped out in January of 2018 and has traded sideways ever since. It is, quite literally, trading at nearly the same price today as it did in February 2018.
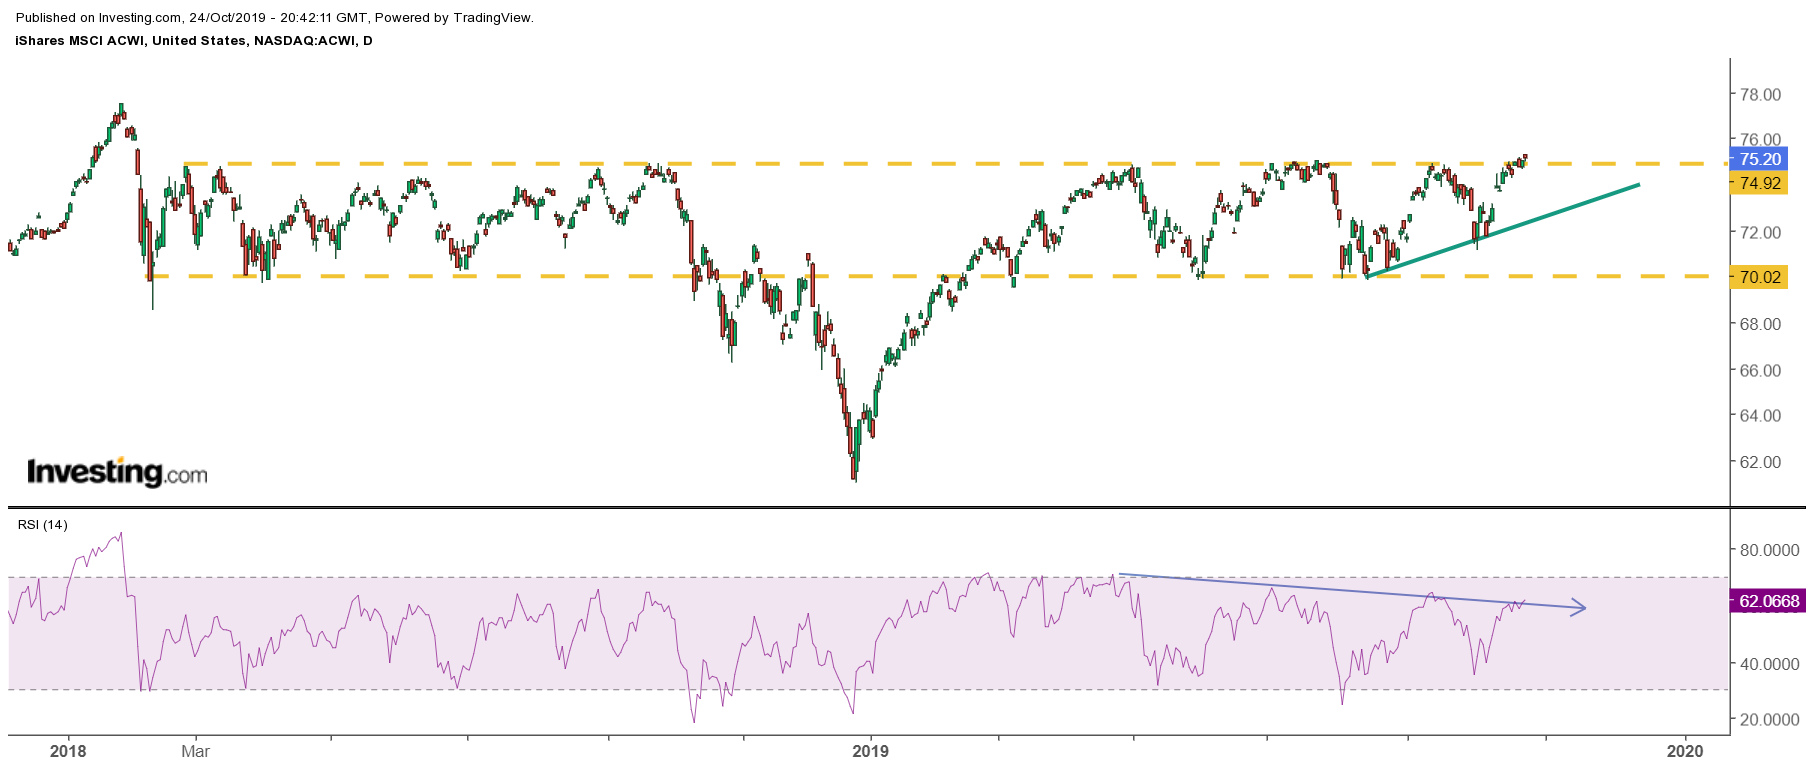
Now, the ETF is knocking on the door of a big break out, having failed to rise above resistance three times at $75.20 since April 2019. To this point it has avoided the dreaded triple-top reversal pattern. It means the ETF is very close to rising back to its all-time highs of around $77.70 and possibly pushing beyond. Since Feb. 1, 2018 the ETF is down 1.3%, versus the SPDR S&P 500 ETF’s (NYSE:SPY) gain of about 6.5%.
A Big Break Out Approaches
The chart shows that the ETF has essentially traded in a range of $69.75 to $75.20 since February 2018, except for the drawdown in the fourth quarter of 2018. The region around $75.20 has acted as a very strong level of resistance for the ETF since May 2019.

The ETF has reached technical resistance at the $75.20 level on three occasions in 2018: in May, July, and September. Each time the index failed to rise above the resistance level. Two of those times, in May and in August, it was able to hold technical support at $69.75. However, after the ETF failed at resistance in September, it made a higher low and created the beginning of a new uptrend.
Additionally, with the ETF now attempting to break out for the fourth time, the chances it will happen are rising. That is because the ETF was able to avoid a bearish reversal pattern known as a triple top. Generally, on the fourth attempt stocks and indices tend to push through resistance.
Also, the relative strength index is showing that bullish momentum in the ETF is building, as It has slowly been rising and is very close to breaking a downtrend of its own.
Ex-U.S. is Nearing A Breakout Too?
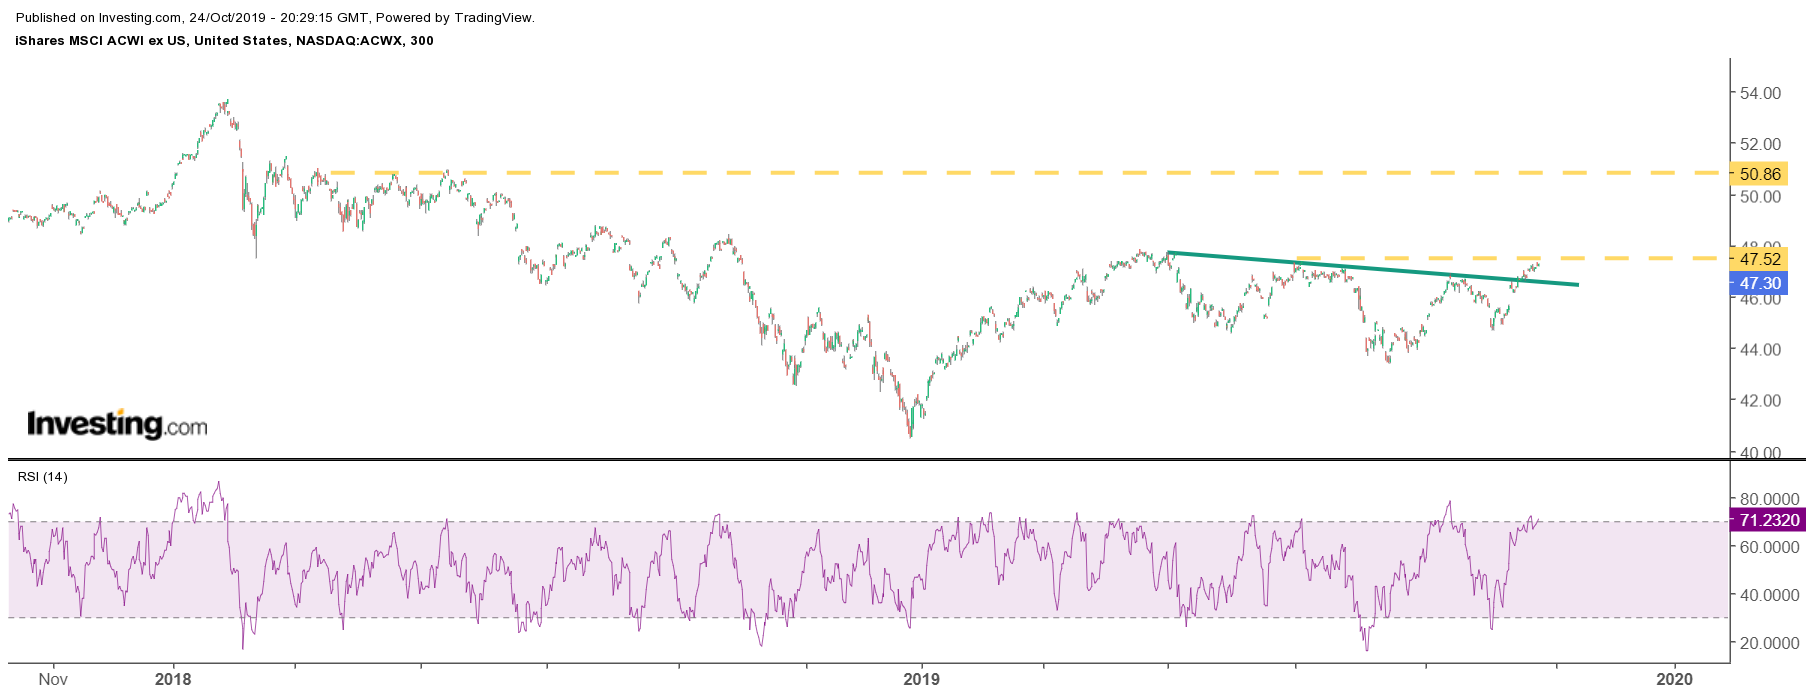
Interestingly, the iShares MSCI ACWI ex US (NASDAQ:ACWX) is showing similar bullish trends. Although the chart does look different, it shows that the ETF has recently broken a downtrend. However, the ETF is confronted with a region of resistance between $47 and $48. If that region can be cleared, it seems like the ETF could go on to rise to around $50.75.

Overall, the trends in the market appear to be bullish — and, in some cases, very bullish. It feels as if the market is waiting for something to take its next giant leap higher. Perhaps that big jump comes in November following the next FOMC rate decision, third quarter earnings or following China's President Xi and U.S. President Trump’s meeting at the Asia-Pacific Economic Cooperation (APEC) in Chile the week of Nov. 11.
750 Points?
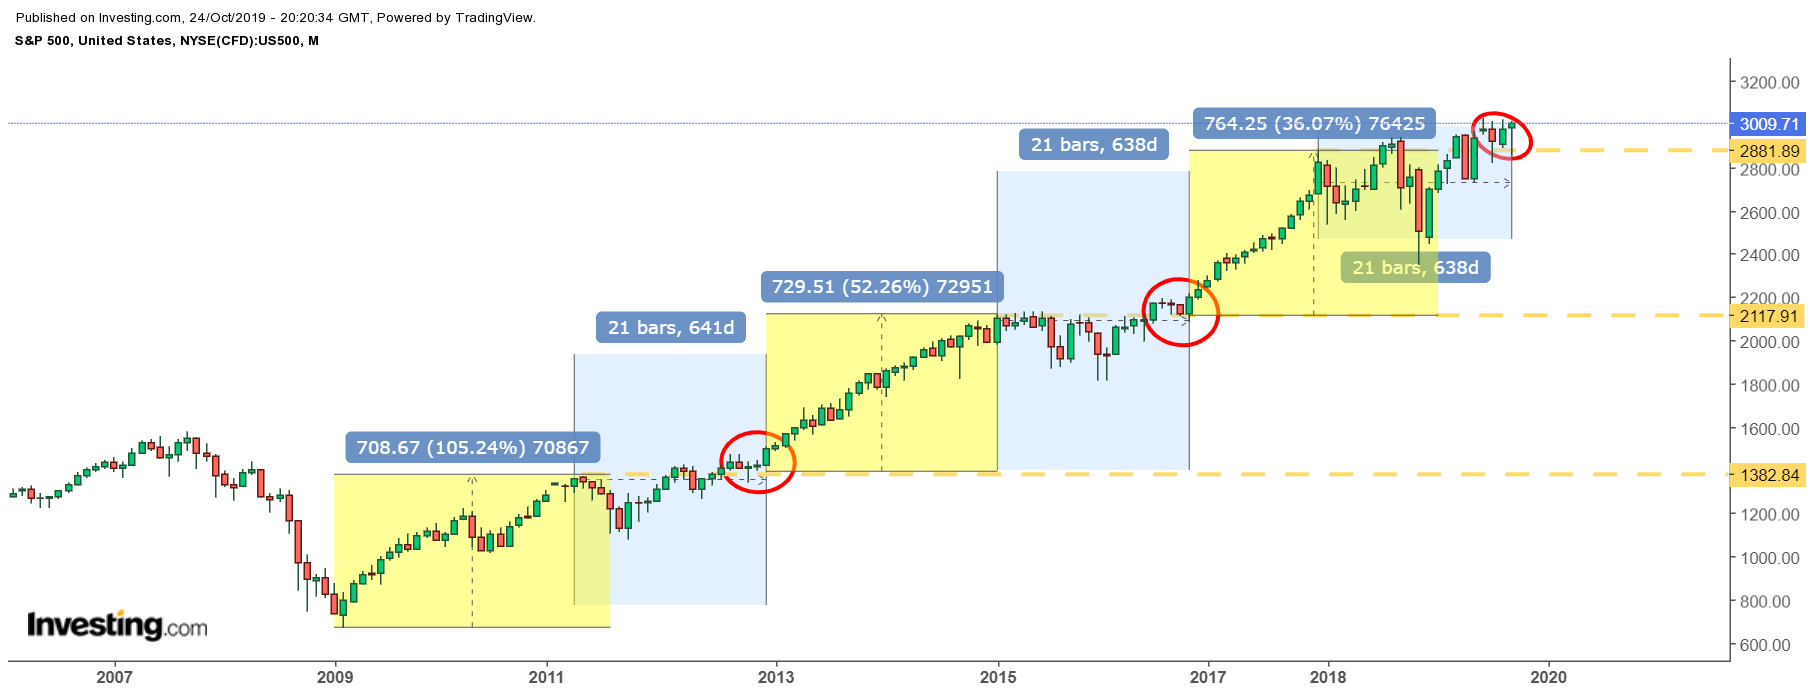
As we move closer to a potential market break out for the S&P 500 and the global markets, another glaring observation becomes apparent, going back to the year 2009. Each time the S&P 500 did rally following a consolidation period, as discussed last week, the S&P 500 increased by nearly the same amount, around 725 to 750 points.

Only time will tell if the next major leg of the bull market is upon us, defying many of the skeptics. While it is impossible to know for sure what happens next, it sure is a lot of fun finding all the pieces and then putting them all together.
