This article was written exclusively for Investing.com
The semiconductor sector has been one of the hottest in the market in 2020 based on the VanEck Vectors Semiconductor ETF (NYSE:SMH). The ETF is up nearly 30% on the year, and up almost 90% off its March lows.
The move in the group has been breathtaking, lead higher by companies such as NVIDIA (NASDAQ:NVDA), Advanced Micro Devices (NASDAQ:AMD), and Qualcomm (NASDAQ:QCOM).
However, signs are emerging that the big move may be due to reverse. There was a substantial bearish bet placed on Monday that the SMH ETF would fall by around 7% from its current price of about $184.50 on Oct. 22. Additionally, the ETF's technical trends have started to break down after its huge run. Couple that with Intel (NASDAQ:INTC), which plunged following its third quarter results that reported weak data center revenue.
A Massive Wager
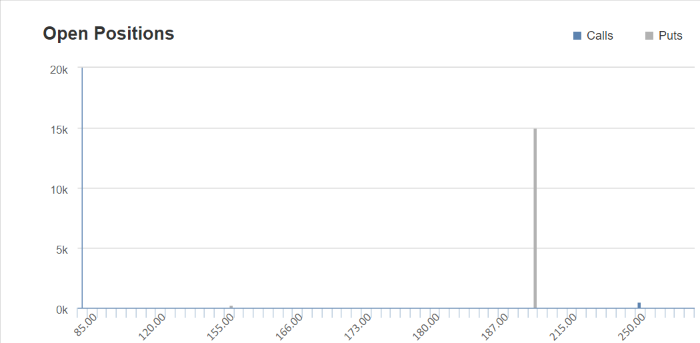
On Monday, Oct. 20, there was a block of 15,000 contracts of the SMH May 21 $200 puts bought for around $27.50. The open interest levels for that contract rose by the same 15,000 contracts the next day, Oct. 21. This suggests a bearish bet was made and that the SMH is heading lower from its current price. For the trader to profit, the ETF would need to fall to $172.50 or lower if holding the puts until the expiration date.
This is a massive wager, with the trader spending around $41.2 million in premiums to make the transaction. Interestingly, it is the only open position in that contract and the largest open interest position among all options in the symbol.

Chart courtesy of Investing.com
Technicals Breaking Down
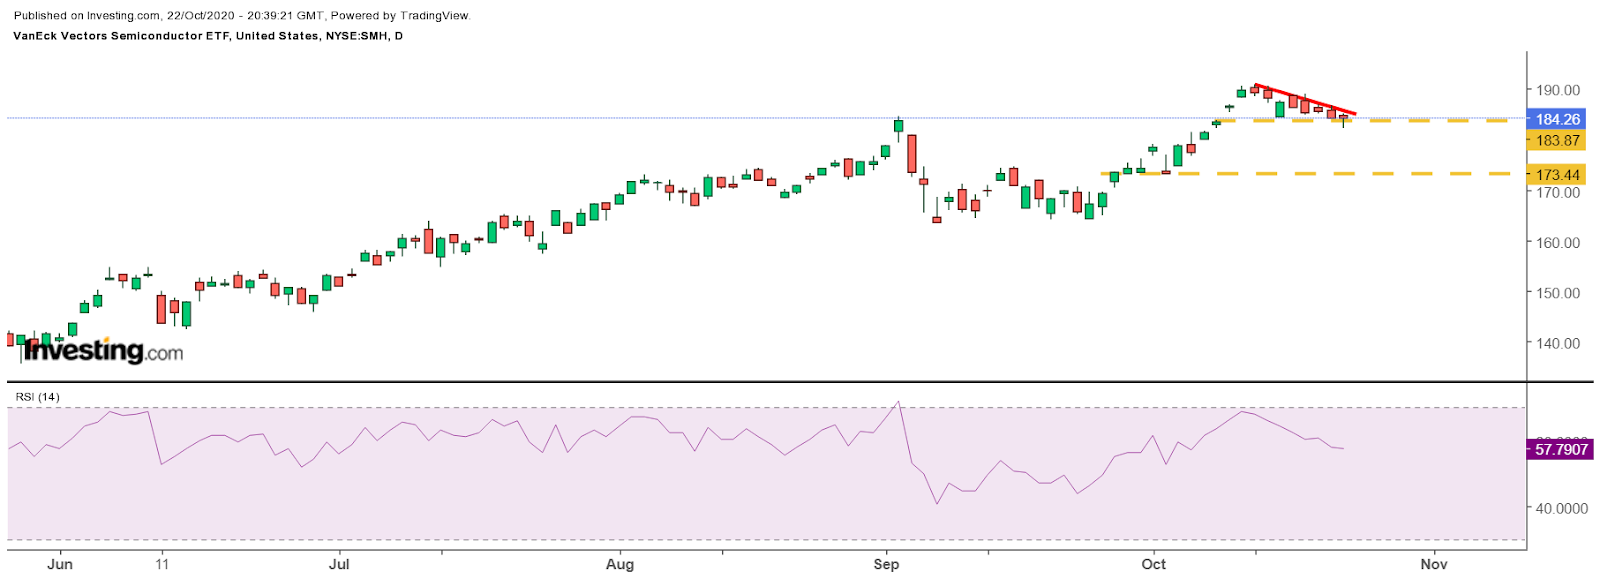
Additionally, the technical chart is flashing warnings too, with a relative strength index that has been trending sideways, despite the ETF reaching new highs. This appears to be a sign of a bearish divergence forming. It would indicate that momentum is now leaving the ETF and that lower prices lie ahead. Also, it seems there may be a descending triangle forming in the ETF, which would suggest it declines to around $174.

AMD Struggles
The weakness can be seen first hand in the very names that helped to lift the ETF higher. Since Oct. 8, AMD has failed to keep pace with the ETF falling by nearly 12%, while the SMH is up almost 1%. NVIDIA shares have also struggled, losing nearly 6% over the same time.
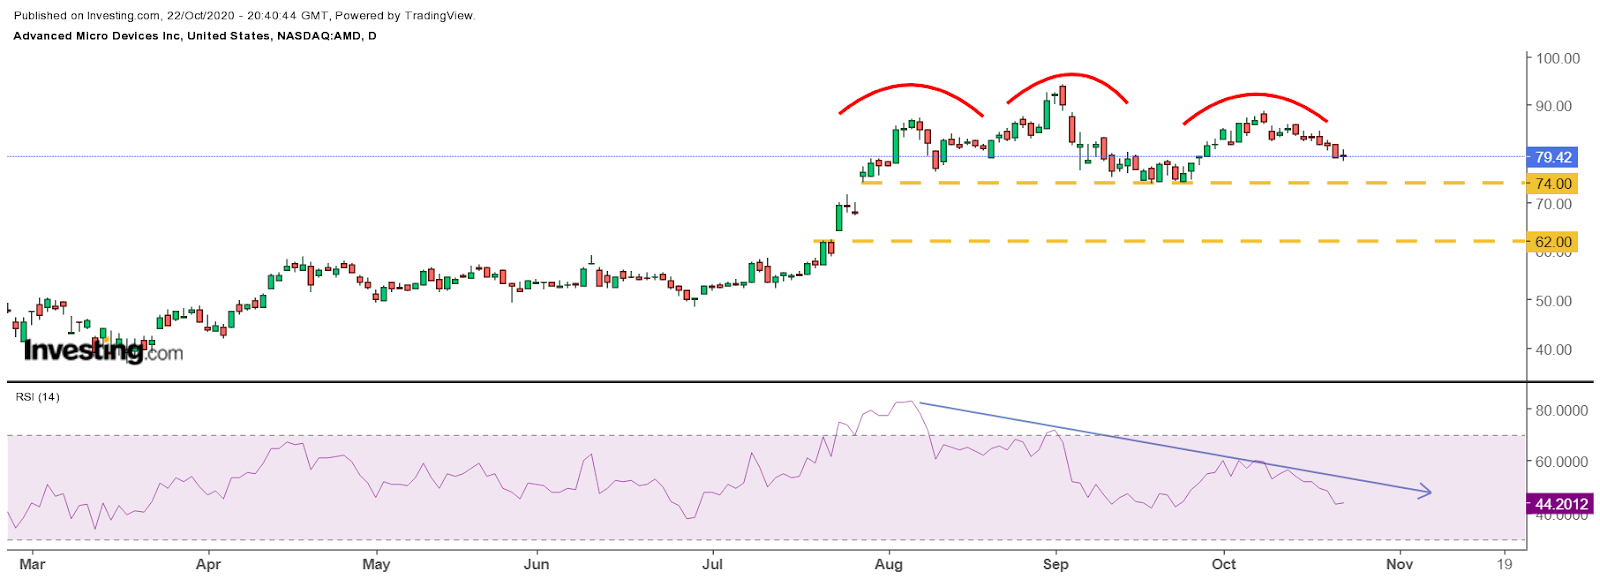
AMD may be in the worst position should the SMH begin to decline. The stock has steadily seen its RSI trend lower since the middle of August, as its share price went on to make an all-time high on Sept. 2. This too, is a bearish divergence that suggests a tremendous loss of momentum, and that lower prices likely are coming. Worse still, the RSI is only in the mid-'40s and would need to drop to 30 or lower before becoming oversold.
Additionally, there is potentially a very bearish reversal pattern formed in the stock known as a head-and-shoulders. Should this stock fall below $75, it would likely confirm that bearish pattern. It could result in the stock dropping to as low as $62

Although it isn't clear why the trader placed that big options bet or what they had in mind. It seems they aren't afraid to step up and put a tremendous amount of money on a directional bet on the sector. Perhaps, they believe what is starting out as a weakness in just a few stocks will spread to the entire group.
Maybe Intel is a sign of what's to come.
