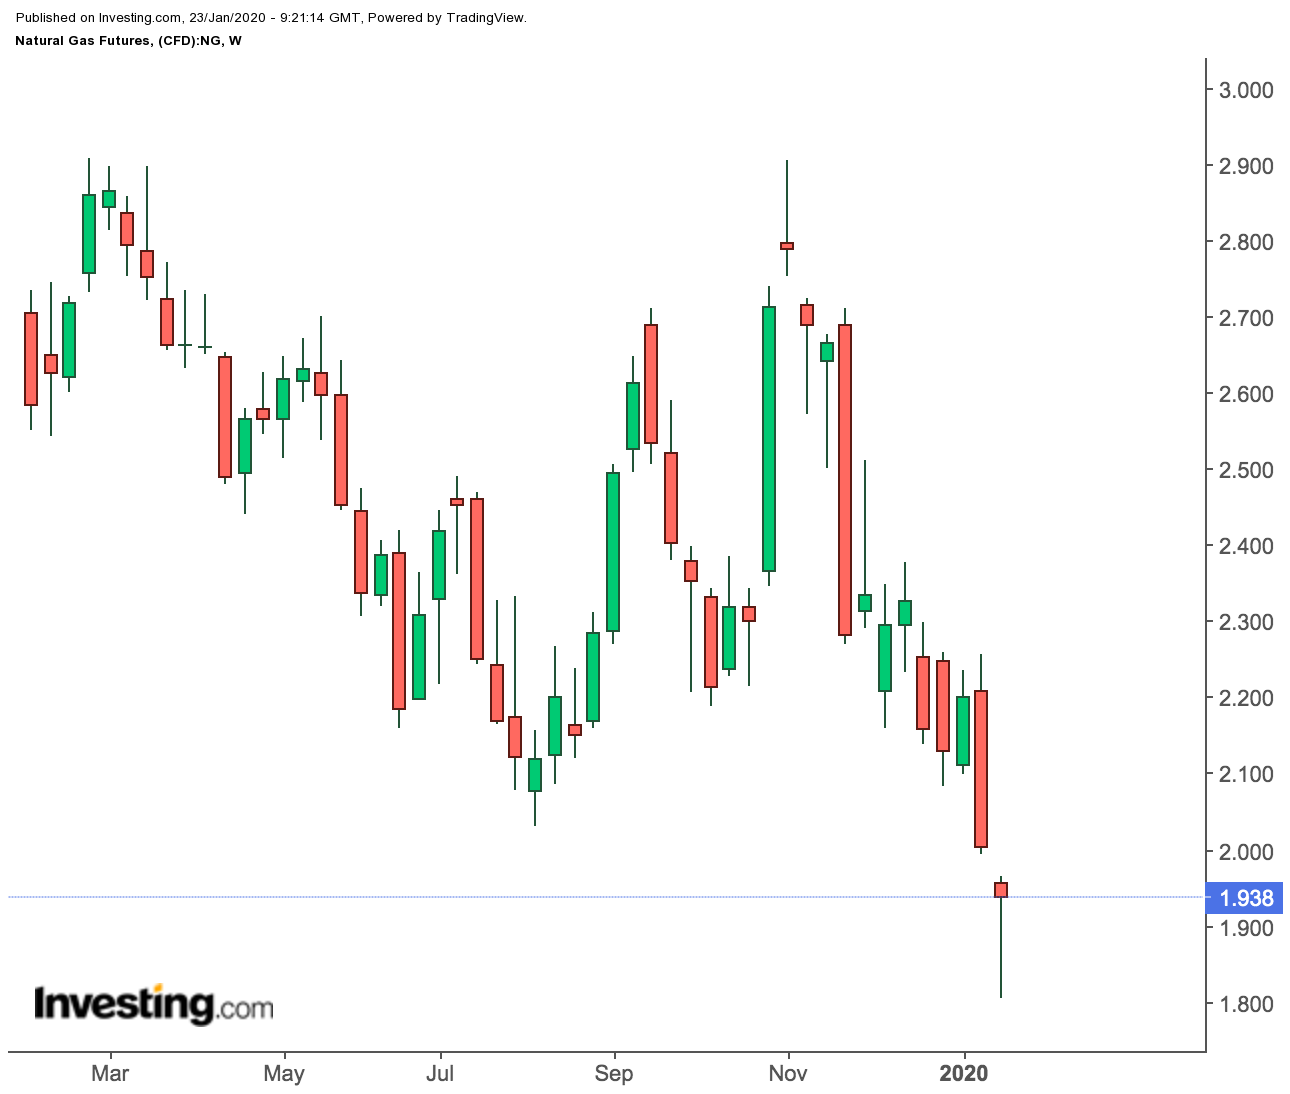
The $2 support for winter-time natural gas — a standard-bearer for heating since 2016 — has crumbled, raising the obvious but yet-to-be-answered question: Where could gas go from here?
After the four-year low of $1.804 struck by the February front-month on the New York Mercantile Exchange’s Henry Hub this week, the first sign was that the market was going up — though the subsequent gain itself had done little to assuage those long gas.
Wednesday’s settlement of $1.905 barely brought the market back toward the broken support, meaning a new perch under $2 would have to be found.
The last time Henry Hub’s front-month gas fell this low was in March 2016, when it sunk to $1.611. Yet, by the close of that March, gas was back at near $1.96, posting a near 15% monthly gain. That was after a combined 27% loss in two prior months.
Gas Prices Down Nearly 30% Since October
This winter though, Henry Hub’s front-month is headed for an even deeper trough of nearly 30% from the end of October.
“Although the market is finding buyers near four-year lows, it is far from the beginning of a robust recovery,” Dan Myers, analyst at Houston-based gas risk consultancy Gelber & Associates, wrote in a note issued Wednesday.
He adds:
“Recent shifts in weather forecasts have already done their dirty work to demand expectations late this month and appear to be cementing the warmer-than-normal pattern through early February. With no relief to be found through sustained, strong weather demand, the full weight of two remarkable years of production growth will continue to press on the market."
What does that mean?
For starters, the gas storage draw for the week ended Jan. 17, due to be reported at 10:30 AM ET (15:30 GMT) by the U.S. Energy Information Administration (EIA), is expected to be slightly smaller than the draw for the week to Jan.10.
Analysts tracked by Investing.com expect a figure of 91 billion cubic versus the previous week’s 109 bcf.
Smaller-Than-Average Gas Draws
If correct, it would mark the fourth consecutive smaller-than-average weekly decrease in gas draws.
More troubling is what could follow.
Myers says after another fairly strong heating report next week in the 100 bcf range, “strong withdrawals are no longer expected to last.”
“This time of year is often when the largest withdrawals of the season occur, but the lack of sustained cold weather this year is preventing any substantial draw-downs in storage,” he wrote.
“Total pulls from storage over the next five weeks is forecast to be 8% lower than average and 16% less than last year, allowing this year’s storage surplus to continue to expand through mid-February.”
Unseasonable Weather
Dominick Chirichella, director of risk and trading at the Energy Management Institute in New York, concurs, saying more unseasonable weather was expected in the coming days.
Accumulating snow was expected across the Midwest through northern New England late this week/this weekend.
“The mild pattern will set up shop across most of the U.S. over the next two weeks overall,” Chirichella wrote in his report, also issued Wednesday. “Temperatures will generally be above normal across the Central and Eastern U.S. for days 11-15.”
While some cooler air will attempt to reach the North Central and Northwest U.S. later in the period, “modest warm anomalies should occur across the Southwest,” he said.
“Confidence is not high on this cooling trend as recent model attempts to bring cooler air into the U.S. at the day 11-15 range have failed and the guidance trended warmer,” Chirichella added.
“Cool risks are starting to creep in, but we are cautious with it for now. Changes were minor overall, but we did trend the North Central U.S, a little warmer.”
Speculators “As Short As They Can Be”
As a group, speculators were about as net short on natural gas now as they’ve ever been, according to INTL FCStone Financial Inc. Senior Vice President Tom Saal.
“The way I calculate it, it’s the largest net short since 2006,” Saal said in an interview with naturalgasintel.com, noting that 2006 is as far back as his dataset goes.
“As far as getting more short, that’s the $64,000 question. Can the speculators get more short? And the answer is, of course they can. To get more net short, I would think you’d need more money, more new shorts” to enter the market."
Saal said he was “surprised” by the “aggressive selling” that has seen the February contract drop from above $2.20 as recently as last week to now down well below the $2 mark. This move lower occurred with “pretty good volume,” he said.
As for Wednesday’s price action, he said: “It didn’t look like any new selling coming into the market, and it didn’t look like any new buying either. I think people were trying to figure out what happened.”
But some volatility could also be in store as the extent of the net short position now raises the prospect of a rally on buying momentum from short-covering, said Saal.
“What you have now is a situation where they may have unrealized gains,” he said.
“That looks good on paper, but until you actually cash in the trade you haven’t made any money yet. So yeah, there’s some major league buying coming, and if it’s the speculators covering shorts, it’ll be motivated buyers.”
