This article was written exclusively for Investing.com
- A rough time for coffee producers in 2018 and 2019
- Brazil is the leader in output
- 2008-2011 could provide clues for the soft commodity
Arabica coffee beans trade in the futures market on the Intercontinental Exchange ICE. Coffee is a member of the highly volatile, soft commodity sector of the asset class. As an agricultural commodity, one of the most significant factors for the path of least resistance of the price of coffee beans is the weather in the leading growing regions of the world. Each year is a new adventure in the coffee market because of the weather, as well as the short-shelf life of the product. Coffee beans can only sit in storage facilities for a brief period before they lose aroma and potency.
While supplies of coffee each year can vary significantly, the demand side of the fundamental equation continues to be an ever-increasing factor. At the turn of this century, approximately six million people populated our planet. According to the US Census Bureau, over the past two decades, the number has grown by 27.5% to more than 7.65 billion.
The addressable market for coffee has been accelerating by leaps and bounds. Aside from population growth, more people in Asia have switched from tea to coffee consumption. Over the past years, Starbucks (NASDAQ:SBUX) opened over 5000 stores in China, and many other copycat coffee shops have popped up in the world’s most populous nation. Each year, the demand for coffee beans increases and production must keep up with the trend in consumption.
Since the early 1970s, the price of coffee futures on ICE has traded as low as 41.50 cents per pound and as high as $3.375 per pound. Coffee is a highly volatile commodity, and at just below the $1 level at the end of last week, it was closer to the long-term low than the high. Coffee is near the low end of its pricing cycle.
Rough time for coffee producers in 2018 and 2019
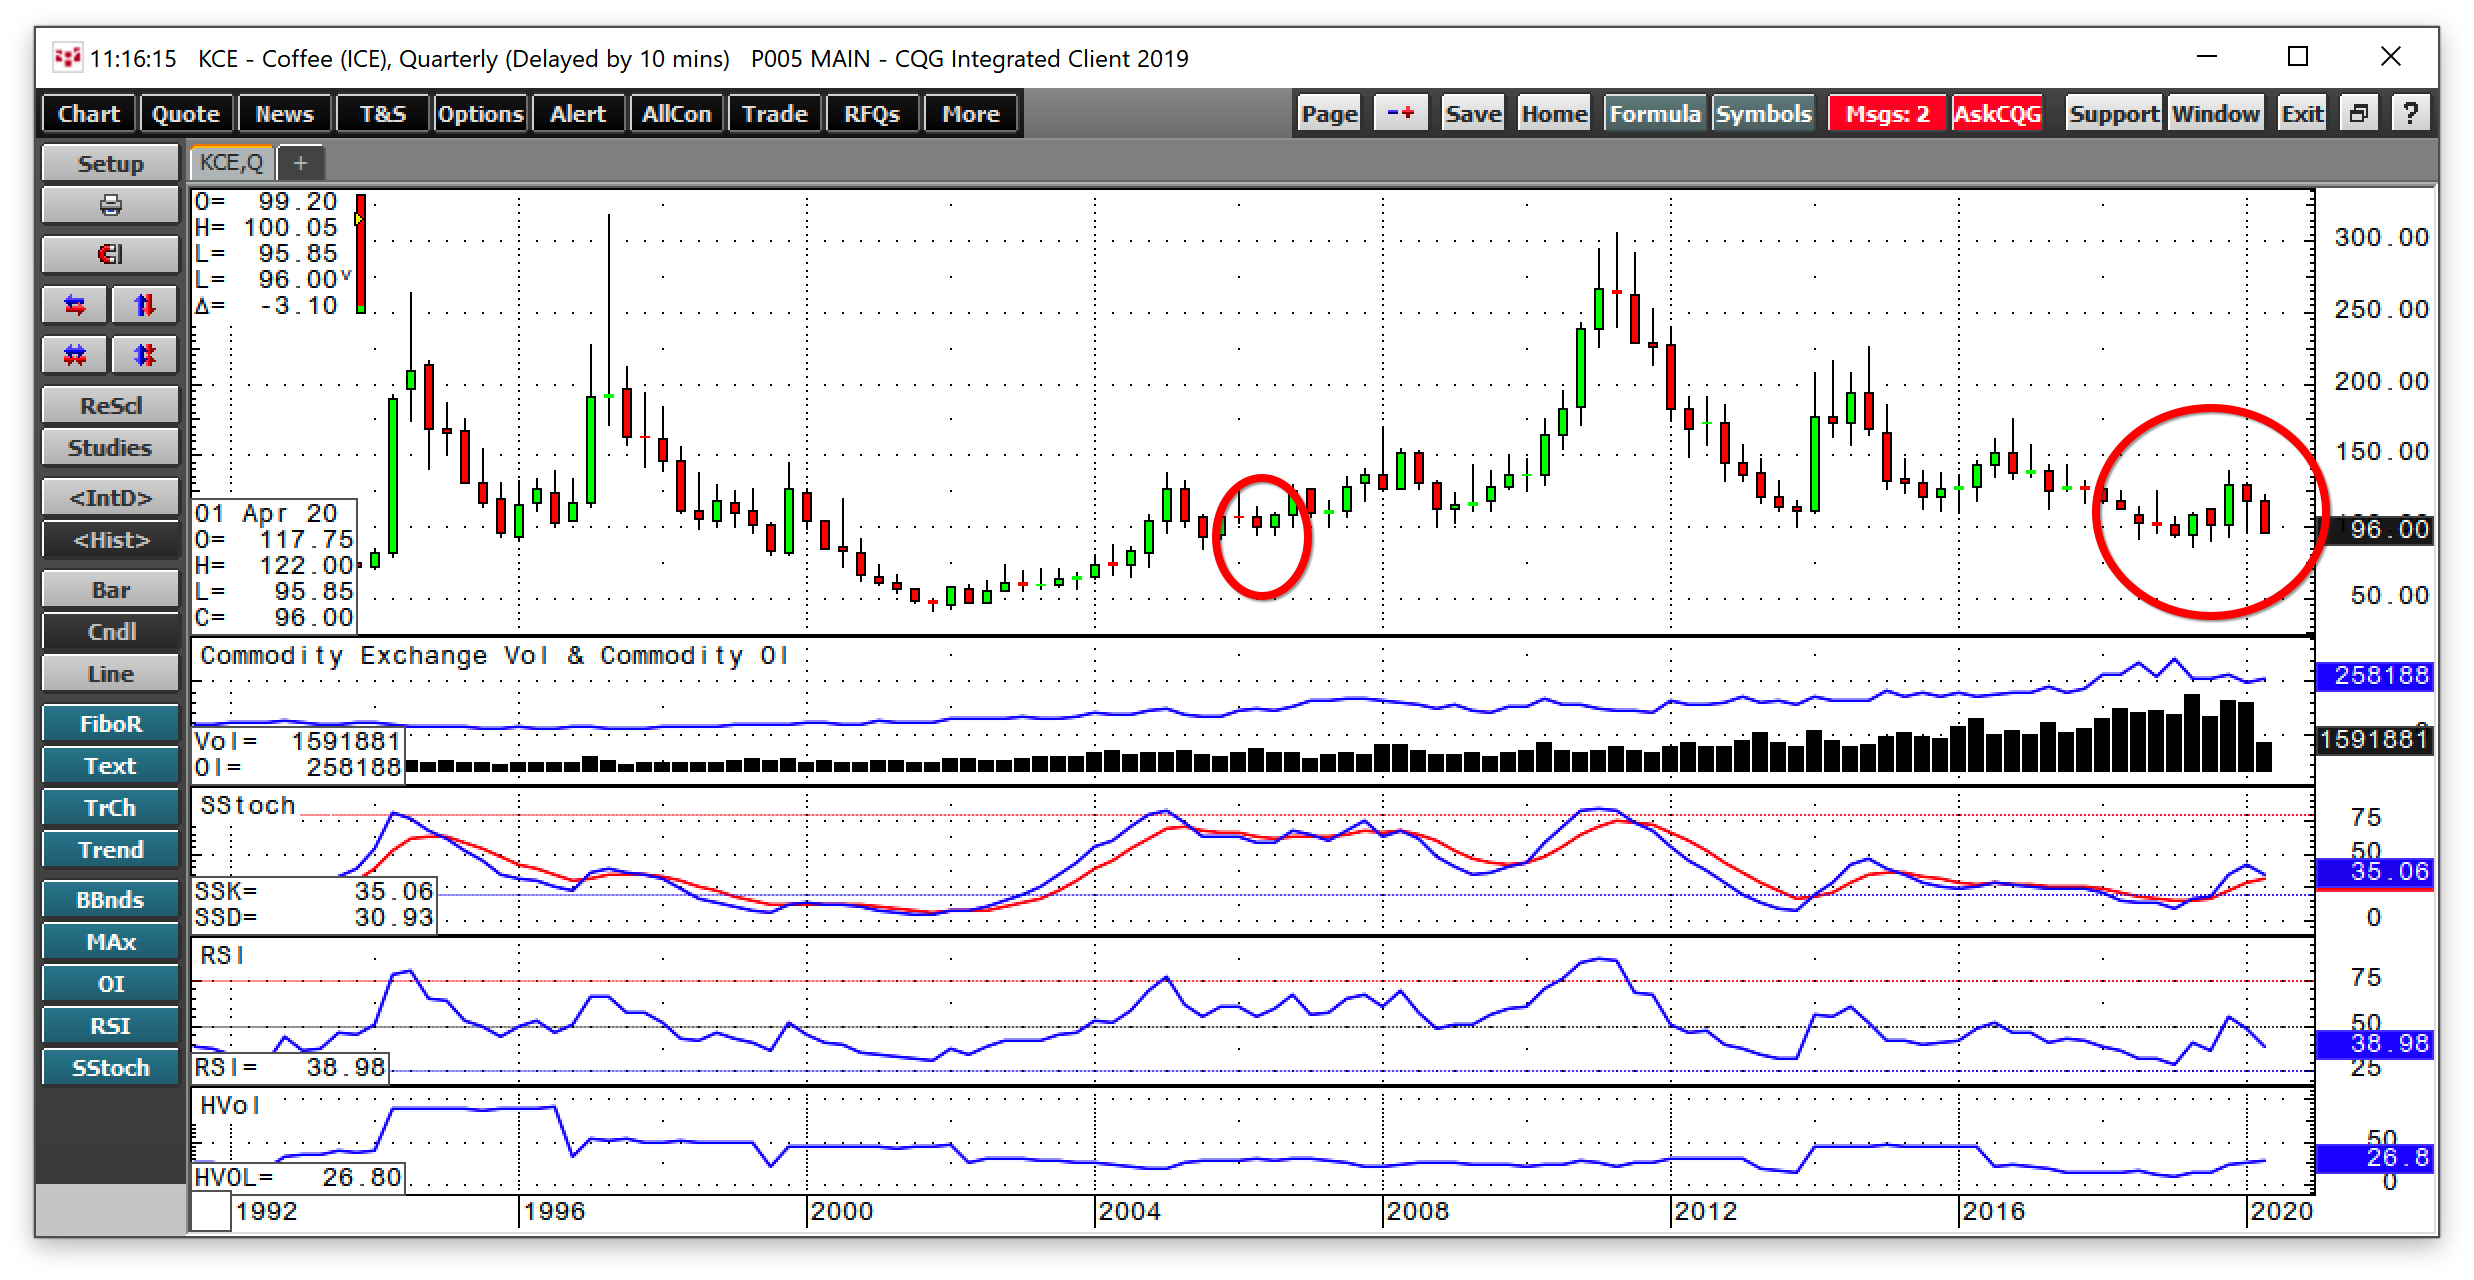
Before 2018, the last time coffee futures on ICE traded below $1 per pound was in 2006.

Source, all charts: CQG
The quarterly chart shows that in 2018, coffee futures slipped to a twelve-year low at 92 cents per pound. In 2019, the price fell to 86.35 cents, a level not seen since 2005. However, a recovery followed each move lower. In 2018, the bounce took the price to $1.255, and in 2019 to $1.3840 per pound. Coffee has been making lower lows and higher highs over the past two years.
The low during this century came last year. The high was at $3.0625 in 2011, when commodity prices experienced a secular rally. The recent low prices occurred because of sufficient supplies that satisfied global demand. However, the currency market plays a significant role when it comes to price weakness in the coffee futures market.
Brazil is the leader in output
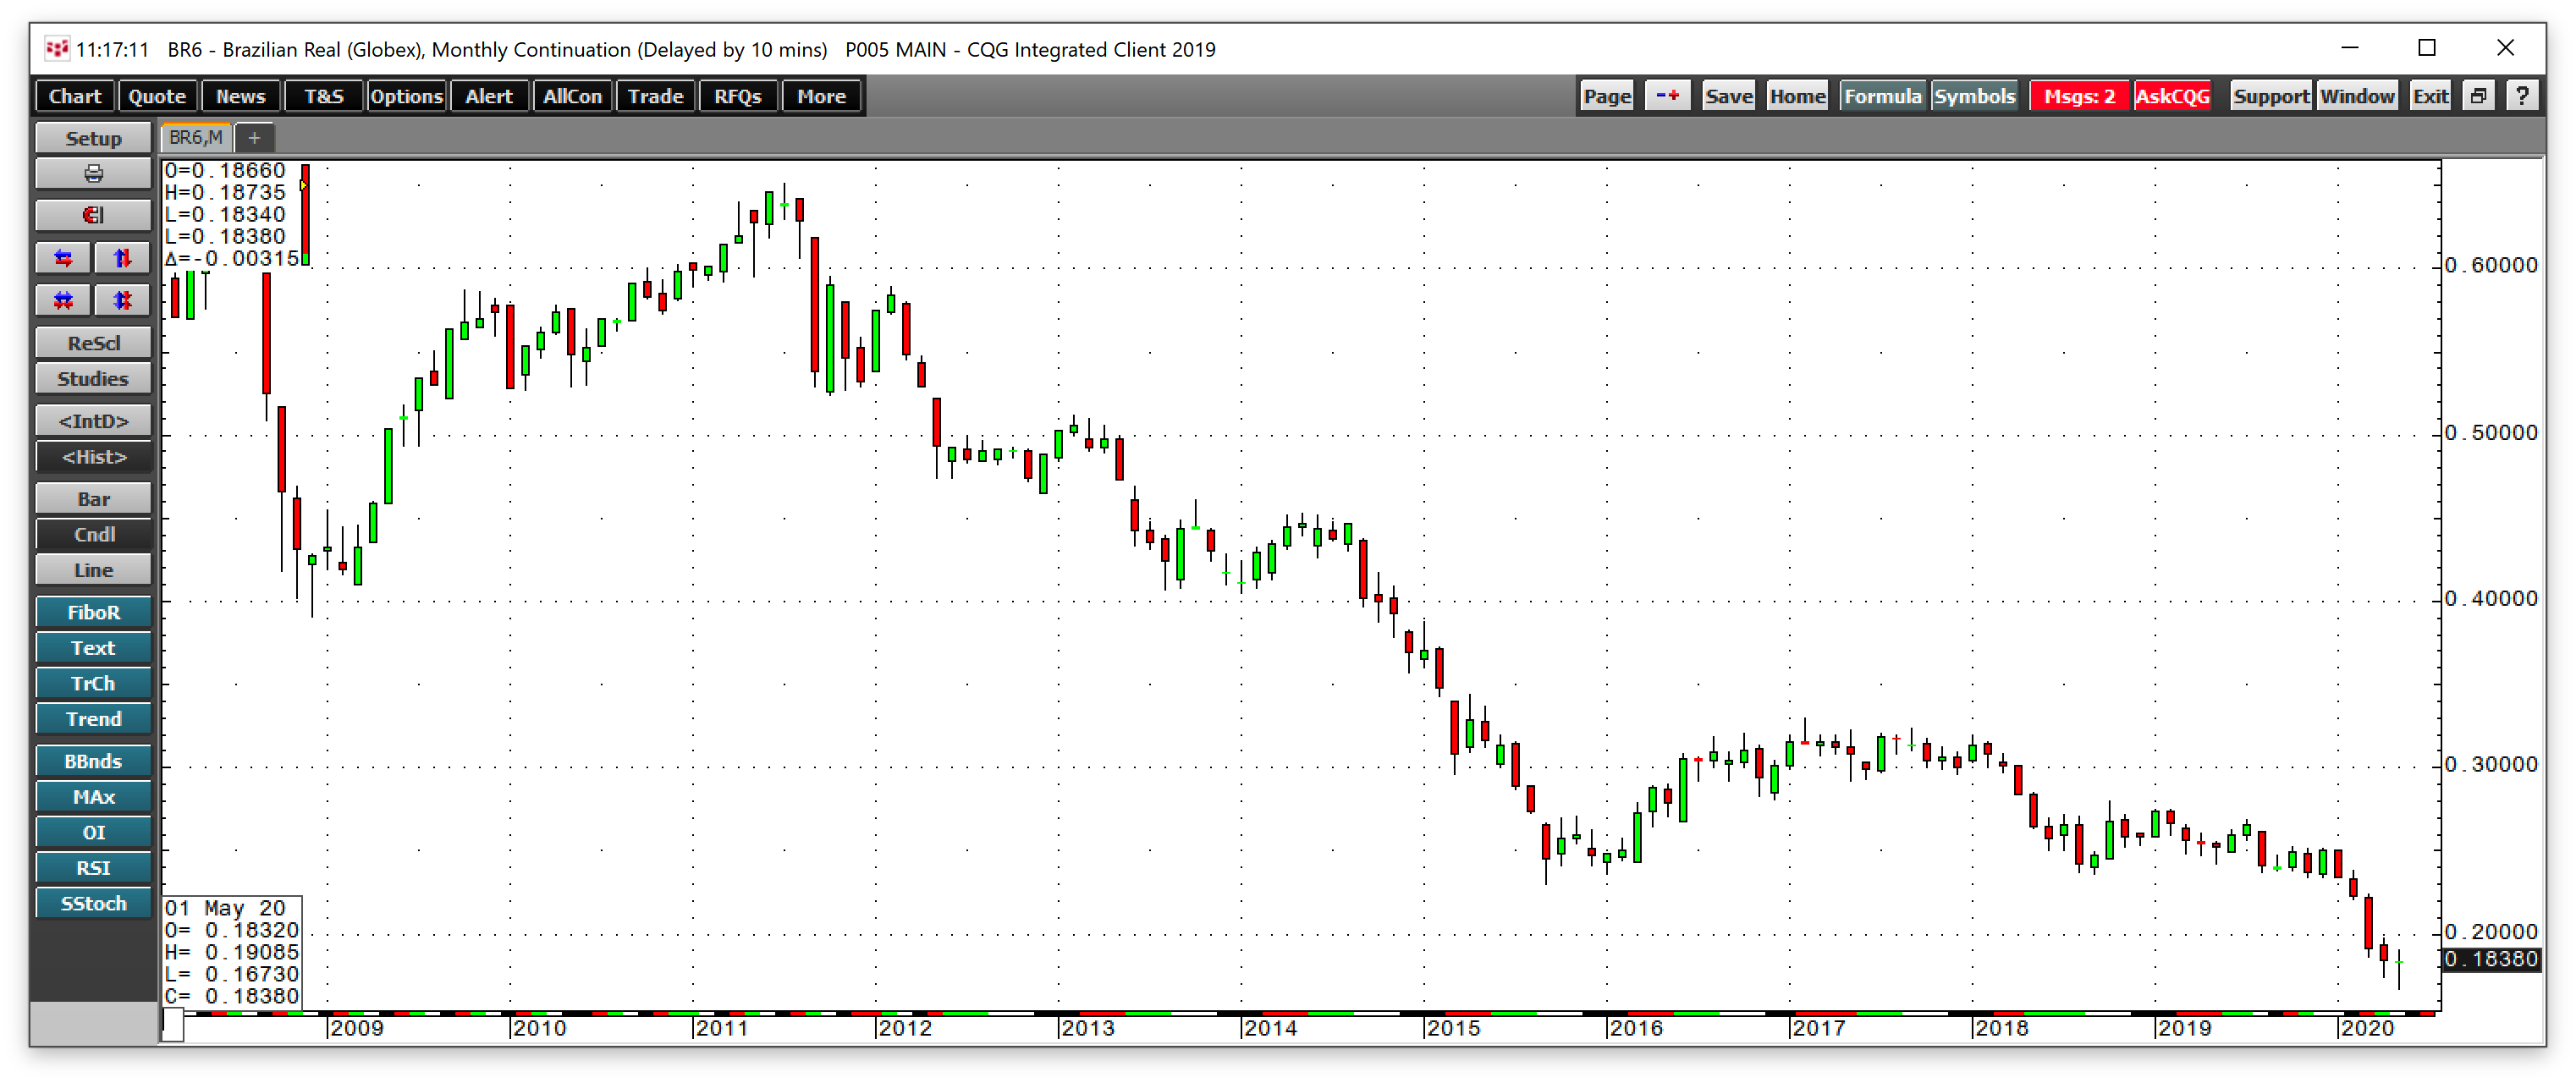
Brazil is the world’s leading producer of Arabica coffee beans. While the US dollar is the world’s reserve currency and the pricing mechanism for the coffee futures market, the Brazilian real plays a substantial role in Brazil’s production costs. A weak real makes Brazilian exports more competitive in global markets, and the currency has been falling like a stone since 2011. 
The chart of the currency relationship between the Brazilian real and the US dollar shows that it dropped from $0.65095 in 2011 to the most recent low of $0.1673 in May 2020. Coffee reached its high in 2011 at $3.0625; the Brazilian currency was on its high. On Friday, May 29, nearby coffee futures were at the 96.00 cents per pound level, 68.7% below the 2011 peak. Meanwhile, the real was trading at $0.18380 against the dollar, 71.8% below its peak. Therefore, in Brazilian real terms, coffee prices were higher at below $1 than they were nine years ago at over $3 per pound.
Coffee is not the only commodity that comes from Brazil. The South American nation is also a leading producer of sugar, oranges, ethanol, and a host of other raw materials and agricultural products. A secular rally in the commodities market could push the level of the real higher over the coming years. It would increase revenues for producers and tax collections for the government.
2008-2011 could provide clues for the soft commodity
The global financial crisis in 2008 caused a flood of liquidity from central banks and governments in the form of stimulus to stabilize economic conditions worldwide. From June through September 2008, the US Treasury borrowed a record $530 billion to fund stimulus. In May 2020, coronavirus’s impact caused the Treasury to borrow $3 trillion, and there is likely more borrowing on the horizon.
A significant reason why commodities prices rallied to multiyear or all-time highs in 2011 was the delayed impact of the stimulus. The waves of liquidity weighed on the purchasing power of all fiat currencies. Moreover, the risk-off behavior in markets in the aftermath of the 2008 crisis caused many producers to reduce output.
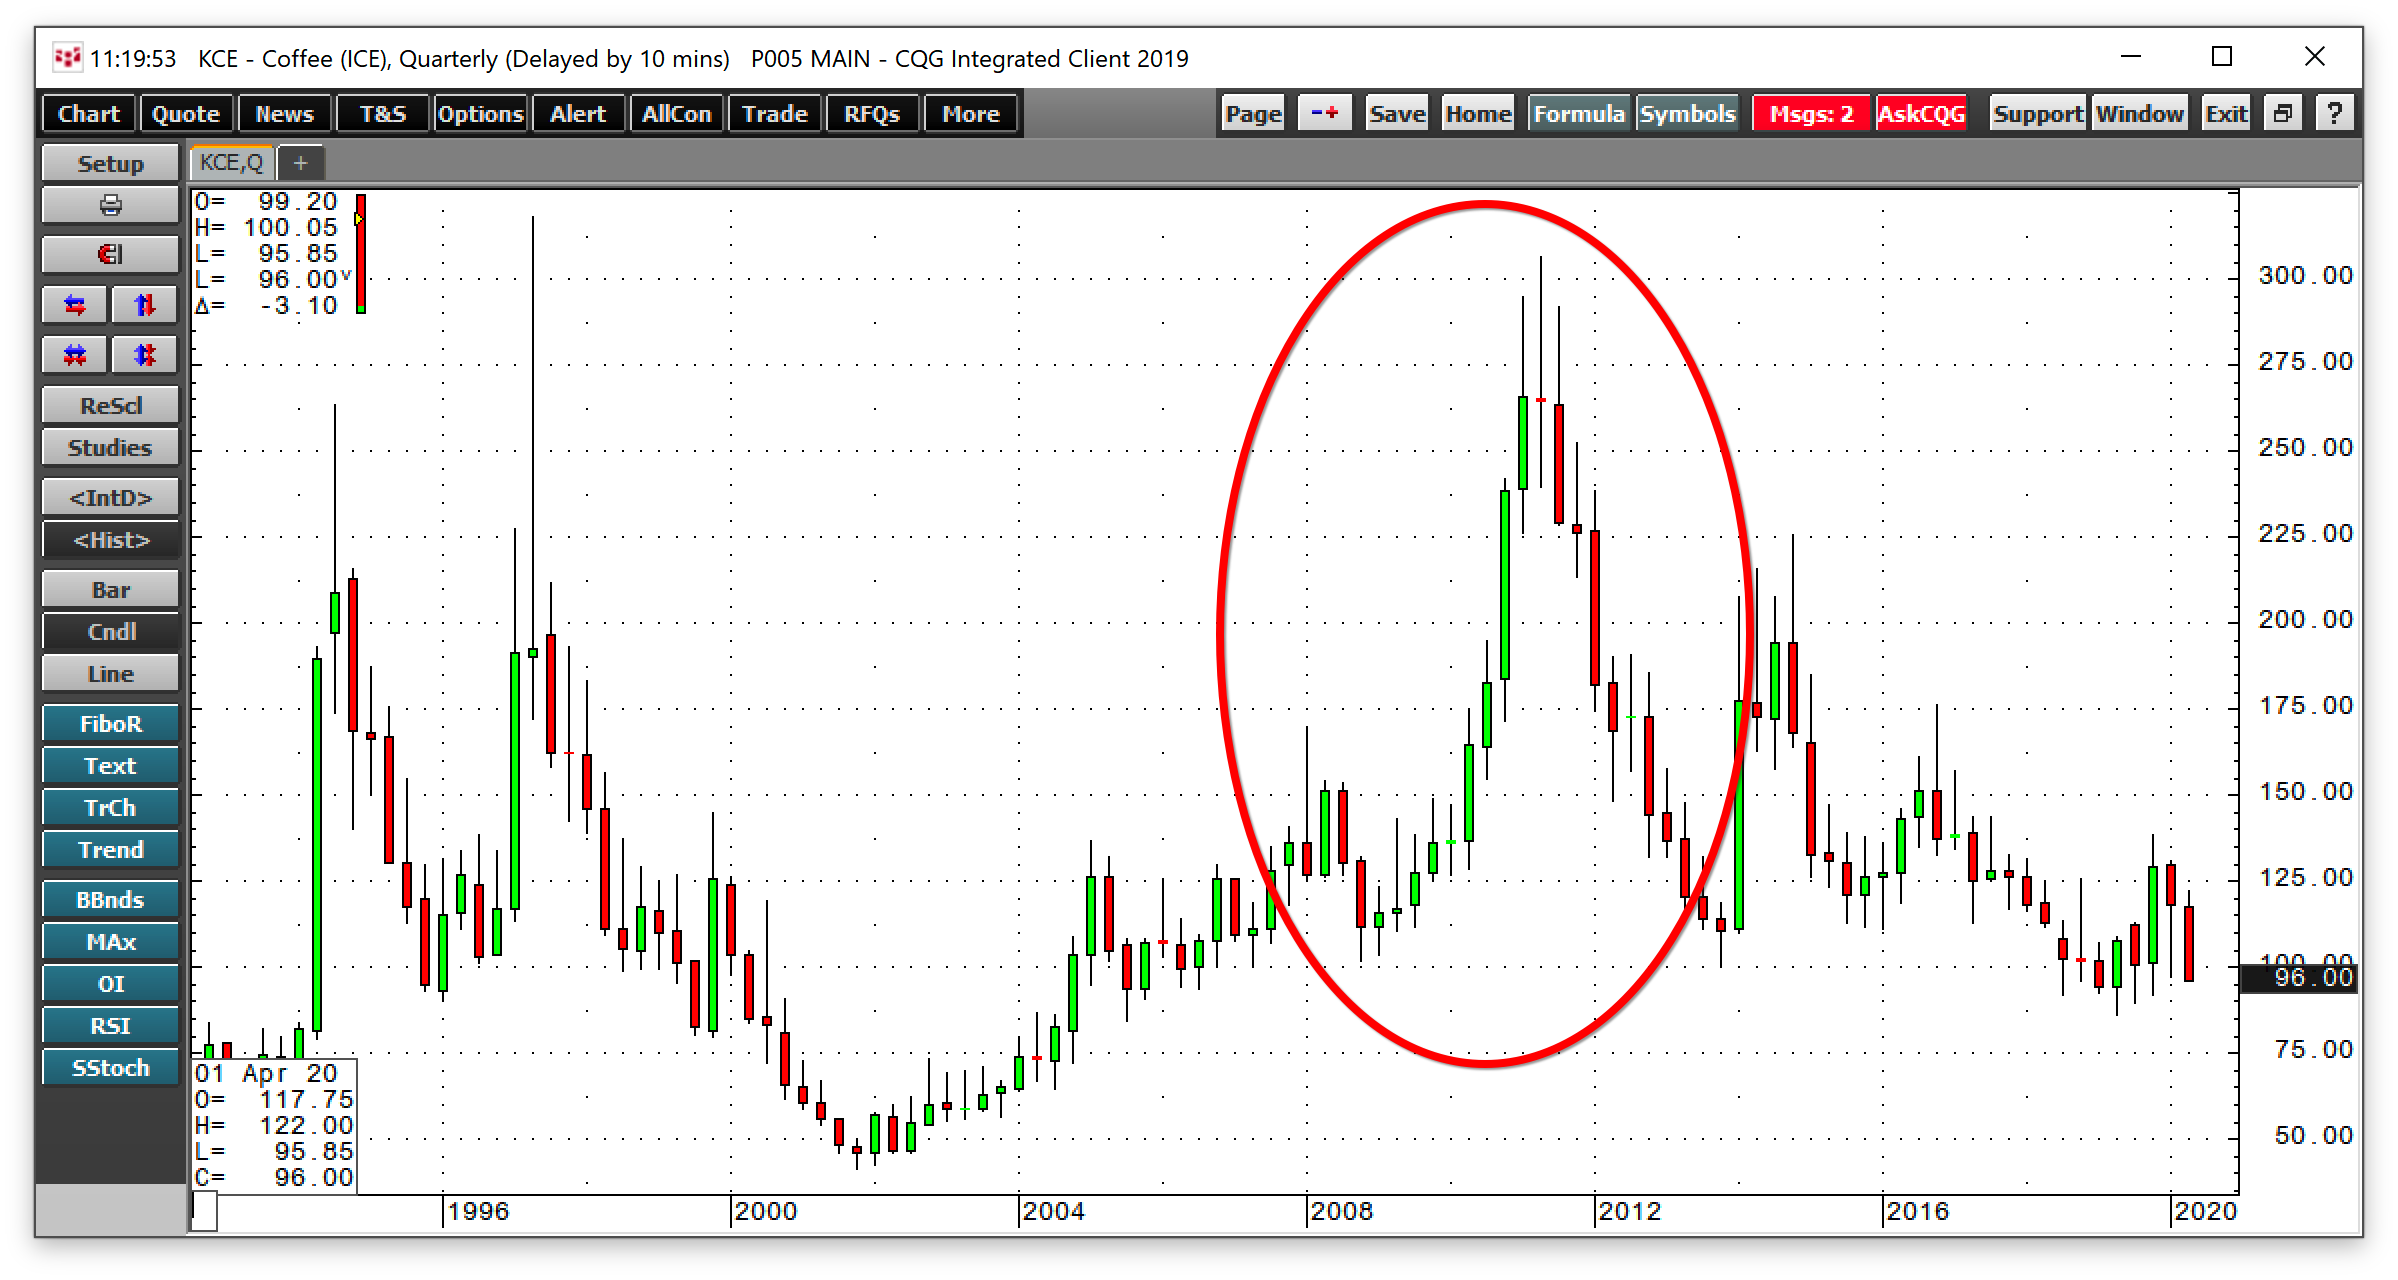
In the world of commodities, the cure for low prices is low prices. Demand increased at low price levels at a time when production slowed, leading inventories to decline. By 2011, shortages pushed the prices of many commodities to lofty levels. In 2020, the waves of liquidity turned into a tidal wave. A similar response from markets over the coming months and years could ignite a rally in commodities that replicates or perhaps dwarfs the price action that took them to peaks in 2011.

The quarterly chart above illustrates that the price of ICE coffee futures fell to a low of $1.017 per pound in 2008 and more than tripled by 2011 when they touched a high of $3.0625 per pound.
At below the $1 per pound level on the nearby coffee futures contract, risk-reward favors the upside. An inflationary surge or rally in the Brazilian real versus the US dollar could cause coffee prices to percolate on the upside once again.
