by Clement Thibault
Facebook (NASDAQ:FB), the social media giant, is expected to report Q2 2017 earnings on Wednesday, July 26, after the market closes. Wall Street's consensus is for $1.15 earnings per share on $9.1 billion in revenue.

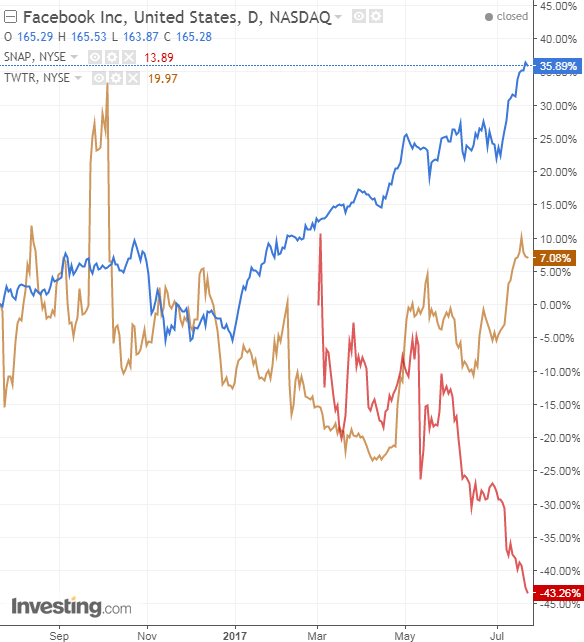
There was a time, just a few years go, where it was harder to evaluate Facebook on a true fundamental level. The stock, which started trading during May 2012, was relatively new and the company was young, much like Snap (NYSE:SNAP) today.
Since then, of course, Facebook has grown into a fully fledged company, a behemoth even; it employs over 18,000 people; brings in over $30 billion in annual revenue; and is worth almost half a trillion dollars.
Now that Facebook has matured, it's much easier to evaluate it using traditional metrics. Significantly, though it fits squarely into the social network niche, Facebook chose to monetize its services by charging advertisers for space on the network. Meaning that currently most of Facebook's income is derived from its ability to show the right commercials to the right target audience. As an online advertising company, here are eight key fundamentals we're watching when Facebook reports:
1. User Growth
For subscription-based services, user growth is one of the most important metrics to consider. But unlike companies such as Netflix (NASDAQ:NFLX), most social networks are free and there's no cost to join. As such, the number of users dictates how many potential viewers there might be for any ads displayed, and therefore how much revenue each placement could potentially bring in.
Facebook recently hit a new benchmark, 2 billion monthly users, and as of last quarter grew its number of users by 17% year-over-year. Most of the growth came from the Asia-Pacific region, where the number of users grew 26% during the past year.
Perhaps one of the most encouraging measures regarding users is Facebook's ability to 'addict' its audience to the platform, turning monthly users into daily users, even as the overall numbers continue growing. Three years ago, 63% of Facebook's 1.27 billion users were daily users. Today, 66% of Facebook's 2 billion users are daily users. Facebook is not only adding users, the numbers show it's also improving the daily appeal of the platform—which could be a decisive factor when new user growth slows.
2. Revenue Growth
Facebook has been on the fast track ever since its IPO. What started with $731 million in quarterly revenue, in five years has become a mammoth $8 billion in quarterly revenue, for a compound annual growth rate (CAGR) of 49%, a rate maintained in Facebook's last report, when it grew 49% from Q1 2016.
Over the past few quarters, Facebook has indicated that it is expecting its growth rate to slow, given that ad load is close to being maximized. However, markets still anticipate Facebook's revenue will grow by more than 40% this coming quarter.
3. EPS Growth
While revenue growth has been a part of Facebook's DNA since the beginning, earnings (Net Income and EPS) are something relatively new for the company, dating back just to December 2015. Moving from in-the-red to barely profitable (in 2012) to robust profitability is a critical step in the success of any business. Look no further than Twitter's (NYSE:TWTR) ongoing struggles as an example of the difficulty entailed.

Facebook is on the growth fast track. Its CAGR has been magnificent since the company began efforts about two years ago to seriously grow the bottom line: 84% for the past two years, moving from $896 million in net income to $3 billion. Today, Facebook's TTM EPS earnings are at $4.1, whereas two years ago they barely reached $1.
4. Margins
This is another area where Facebook now excels, particularly when compared to the competition. Direct competition includes Twitter and Snapchat. However, since neither company is profitable and Snap just recently went public, we can't do a significant margin and return-on-equity (ROE) comparison.
A more appropriate correlation, because Facebook is an online advertising business, would be comparing its margins and ROE to Alphabet (NASDAQ:GOOGL). Facebook has drastically improved both its operating and profit margins during the past two years—going from 30% and 18%, to 45% and 38%, respectively. Alphabet's operating margins have been steady at 26% over the past few years, alongside an equally steady 22% profit margin. Clearly, Facebook manages to not only make money but to retain a healthy amount.
5. Average ROE, ROIC, ROA
Another metric where Facebook has tremendously improved over the past two years is efficiency. Alphabet, being the stable company that it is, has a return of 15%, on equity (ROE) and invested capital (ROIC), and a return-on-assets (ROA) of 13%. Things are looking good at Alphabet.
Facebook's return was on the decline until September 2015, when it hit a low of 8%, 8% and 7% for ROE, ROIC, and ROA, respectively. These aren't actually bad numbers, they're more middle of the pack, but an industry-defining company can't be middle of the pack for long. Happily for investors, Facebook's ROE, ROIC, and ROA are now 22%, 22% and 19% - stellar numbers clearly carved from its expanding profitability.
Facebook's margins were a roller-coaster ride in the past, so we'll continue to keep an eye on these numbers. However, even if this is the top of the cycle, these numbers are incredible; should they shrink by half they'd still be respectable.
6. Debt
This one is easy. While we'd usually look at the company's long-term debt and habitual ratios, none of these apply. Facebook has exactly zero debt on its balance sheet. The company's total liabilities amount to $6.5 billion dollars and it has $32 billion in cash and short term investments. Nothing but good things to see here.
7. Management
Facebook's management is an island of stability within the fast-changing technology world. Mark Zuckerberg founded the company while he was a student at Harvard back in 2004, and has been at the helm of the company ever since. In 2008, COO Sheryl Sandberg was hired. Her experience helped develop the company into a real, profitable business.
An additional benefit: management rarely makes headlines, except when rumors spread that CEO Zuckerberg might be setting up for a presidential run. Unsubstantiated conjecture aside, management runs a very tight operation, flawlessly executing short- and long-term plans.
8. Good Value?
All signs so far point to Facebook being a fundamentally sound company. Not just that, it's also one of the best growth companies around. But any publicly traded company is only a good value at the right price.
With a P/E ratio of 41, some would consider Facebook's stock a bit rich. Other metrics such as a Price-to-Free Cash Flow at 37 compared to Alphabet's 25, and Facebook's Price-to-Book Value of 7.6, compared to Alphabet's 4.7, indicate shares right now are relatively expensive.
Conclusion
There's no contesting the fact that Facebook is a great company. And it will continue to be even if today's report shows that expansion has started to slow down a bit this past quarter. You can only hope for a CAGR of 49% for a limited number of years. So we're OK with Facebook easing a bit on growth.
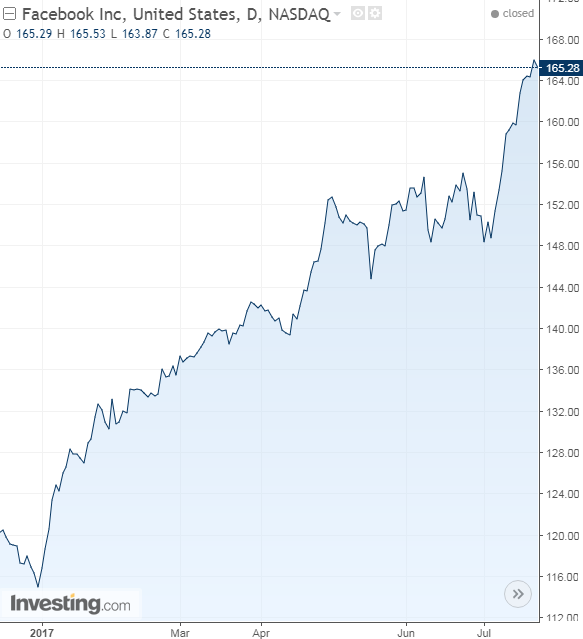
The company also has a stellar balance sheet, and capable management. There's no doubt in our mind that Facebook will still be thriving in upcoming years, and will likely be worth more than its current $165 share price.
However, if we're looking for the most opportune entry, that's not at this level, an all-time high after an 18-day rally which saw Facebook's share price climb $16, or 11%. As an investor, that doesn’t leave much room for error.
We see Facebook is a mid-term, buy-and-hold (3-5 years). We expect it to give back some of its most recent gains, which will allow for a better entry point around $150-$155.
