
This article was written exclusively for Investing.com
The equity markets are in free fall, and everyone is searching for the bottom or signs that at least the bottom may be near. But to this point, some of those classic indicators have yet to show any signs of a capitulation occurring in markets, at least not yet. This could mean that while stocks are down sharply on the year, the bottom may not be close.
Typically, when investors are just trying to sell anything that isn't nailed down to the floor, indicators like the VIX may spike. But to this point, despite the VIX being elevated, there has been no significant spike higher.
The VIX has been very well contained between 20 and 35 since the beginning of the year. One would want to see the VIX break out of that range and make a higher high even to begin thinking about a market bottoming process.

Additionally, the Put-to-Call ratio has been surprisingly low. Typically, when the Put-to-Call ratio has spiked above 1.35, it has been a pretty good indicator of an S&P 500 nearing or at a bottom. Currently, the highest the Put-to-Call ratio has reached has been 1.34. It has been close, but generally, the spike is well above that 1.35 level.

It is also tough to think about a bottom for a broad-based index when economically sensitive averages and indexes are making lower lows, such as the Dow Jones Transportation. It just made a lower low on May 19 and breached some crucial technical support levels in the process.
Even the biotech sector, one of the first groups to start their descent in early 2021, has been steadily dropping and is now trading back to pandemic lows. Typically, when groups like these start trading counter to the broader indexes, it indicates a bottoming process may have begun.

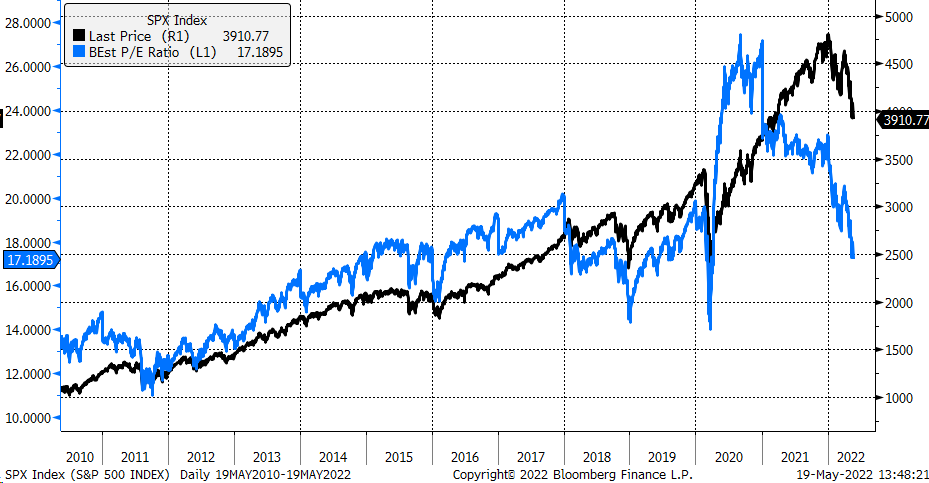
Historically, even from a PE ratio standpoint of the S&P 500, the ratio has bottomed at much lower levels, below 15. During the fall of 2018 and March of 2020, the PE ratio bottomed at closer to 14, which would value the S&P 500 currently around 3,200, or 17.8% lower than where it is trading on May 19.
None of this is to say the index has another 17% to fall, but what it does suggests is that the index hasn't had that moment yet, where it seems like everyone is running for the exits either. It's when everyone is running for the exits, and the sectors that have led the way lower have already started to turn higher, a bottoming process has begun.
On top of that, this bottoming process is likely to be very different from the ones of the past decade because the Fed will not be there to support the market. This time, the market will be entirely on its own, making for a more challenging recovery process than what has been seen in the recent past.
Which stock should you buy in your very next trade?
AI computing powers are changing the stock market. Investing.com's ProPicks AI includes 6 winning stock portfolios chosen by our advanced AI. In 2024 alone, ProPicks AI identified 2 stocks that surged over 150%, 4 additional stocks that leaped over 30%, and 3 more that climbed over 25%. Which stock will be the next to soar?
Unlock ProPicks AI