The RBA cut its cash rate for the third time by 25bps, bringing its total cuts to 75bps for the year. The first cut was in June and then in July. Generally, there is a lag to an expansion in monetary policy and in this article we look at a few key metrics to assess if any of the numbers have responded yet.
Consumer Confidence
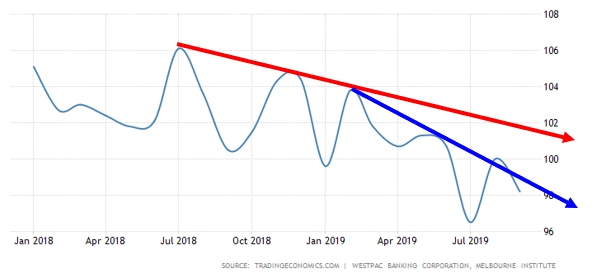
In the above we consider the Melbourne Institute and Westpac Bank Consumer Sentiment Index. We note that the consumer confidence trend is down. Moreover, the decline in confidence has accelerated as per the sift from the red trend line to the blue. This downwards shift in momentum held with the last data release of 92.2, a 1.7% decline from August.
Business Confidence
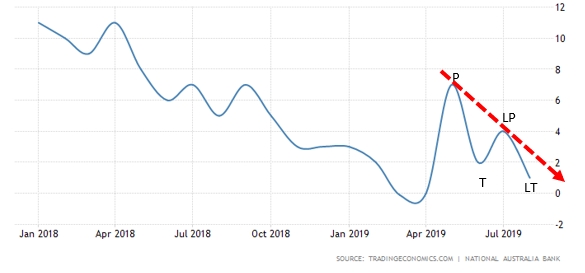
Here we consider the NAB Business Confidence Index. A bounce in June was short-lived. Since then the series has made a lower peak (LP) followed by a lower trough (LT). This is the definition of a downtrend. The momentum of this trend is represented by the red dashed line.
Unemployment
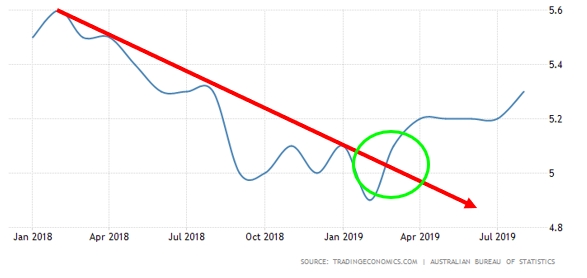
The downwards unemployment trend was broken at the beginning of 2019 (green ellipse) and has been increasing since then. This tick up in unemployment is a concern of the RBA and is one of the key metrics that it pays attention to.
Manufacturing PMI
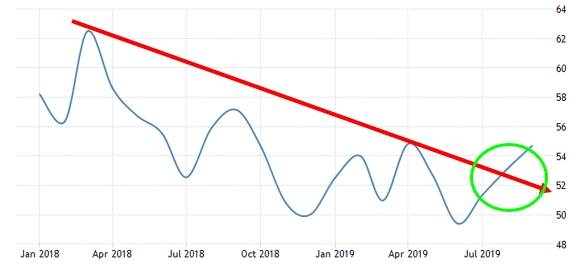
The AIG Australian Performance of Manufacturing series moved to 54.7 at its last print. A reading above 50 is indicative of expansion. Given the dire straits of global manufacturing data this is a good number and, moreover, the print is above the red down trendline. Whilst an uptrend is debatable, the break above the trendline does suggest that the downwards momentum has waned.
Services PMI
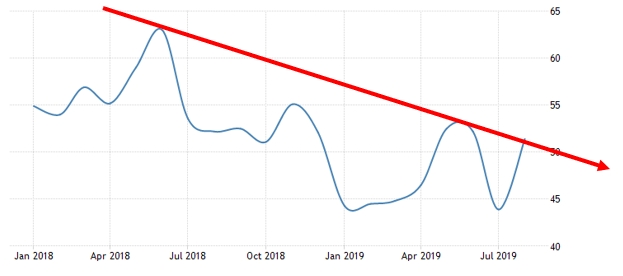
The AIG Australian Performance of Services Index printed at 51.4. This is off the over 5-year low of 43.9 from the previous month. That the series is above 50 is significant in that it is indicative of expansion. However, we note that the downtrend momentum still holds with no definitive break above the red trendline.
Construction PMI
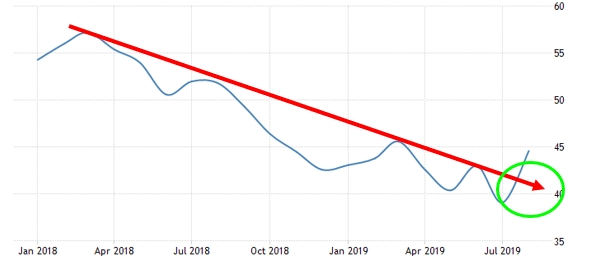
Above we refer to the AIG/HIA Performance of Construction Index. In August it rose to 44.6 from the 6-year low of 39.1. The index is a measure of health in the construction sector. It is still below 50, which means that the sector is contracting. However, importantly the down trendline was broken to the upside (green ellipse). Whilst this does not mean a new uptrend has started, it does suggest that the brutal downwards momentum has slowed.
Conclusion
The interest rate cuts are still to reflect in consumer confidence, which is still showing an increase in momentum to the downside, as well as needing to reflect in business confidence (there was a pop up in June but a downtrend reasserted, with a lower peak followed by a lower trough). Unemployment continues to tick up which may be a particular bugbear of the RBA as it tries to maintain full employment in Australia.
The various PMIs seem to have responded better. Manufacturing has broken above a downtrend line, which is impressive considering the weak global manufacturing numbers. However, services are faring poorly – the PMI has bounced back from contraction but only barely.
Notably, the construction PMI, whilst still signalling contraction, seems to have responded well. It will be interesting to note if it has, in fact, bottomed. There are two points to note here: construction is a very sensitive sector to interest rates, which may explain it last print and secondly, it feeds into other sectors i.e. may trickle through to and potentially benefit other sectors of the economy if it continues to respond postively.
