Renewable energy stocks are on fire in 2020 as companies have seen shares hit all-time highs.
The transition from fossil fuels toward clean energy sources is well underway worldwide and solar, wind, hydro, tidal, geothermal, and biofuel stocks are benefiting. Metrics from Our World in Data show, "In 2019, around 11% of global primary energy came from renewable technologies."
According to the Center for Climate and Energy Solutions, a U.S.-based nonpartisan, nonprofit organization, in terms of electricity generation in the U.S., numbers from 2018 showed a 17% share for renewables with the majority from hydropower, 7.0%, and wind power, 6.6%.
The organization adds:
"Solar generation (including distributed) is projected to climb from 11 percent of total U.S. renewable generation in 2017 to 48 percent by 2050, making it the fastest-growing electricity source.”
The sun is a major source of abundant and free clean energy. Over time, the technology behind capturing and storing solar energy, or harvesting solar energy has both improved and become cheaper. Solar energy can typically be harvested either as a single photovoltaic cell or a full solar farm.
Recent research by the Organisation for Economic Co-operation and Development (OECS) confirms “Solar photovoltaics (PV) is driving the growth of renewable power capacity around the world.” China currently “accounts for over 70% of global solar PV module manufacturing.”
Meanwhile, if President-elect Biden can carry out his election promises on clean energy, the U.S. will likely see more environmentally-friendly federal policies. Most analysts expect the alternative energy industry in the U.S. to grow significantly within the decade.
Here we'll look at two exchange-traded funds (ETFs) for investing in renewable energy long-term:
1. First Trust NASDAQ Clean Edge Green Energy Index Fund
- Current price: $56.60
- 52-week range: $16.14 - $59.75
- Dividend yield: 0.31%
- Expense ratio: 0.60%
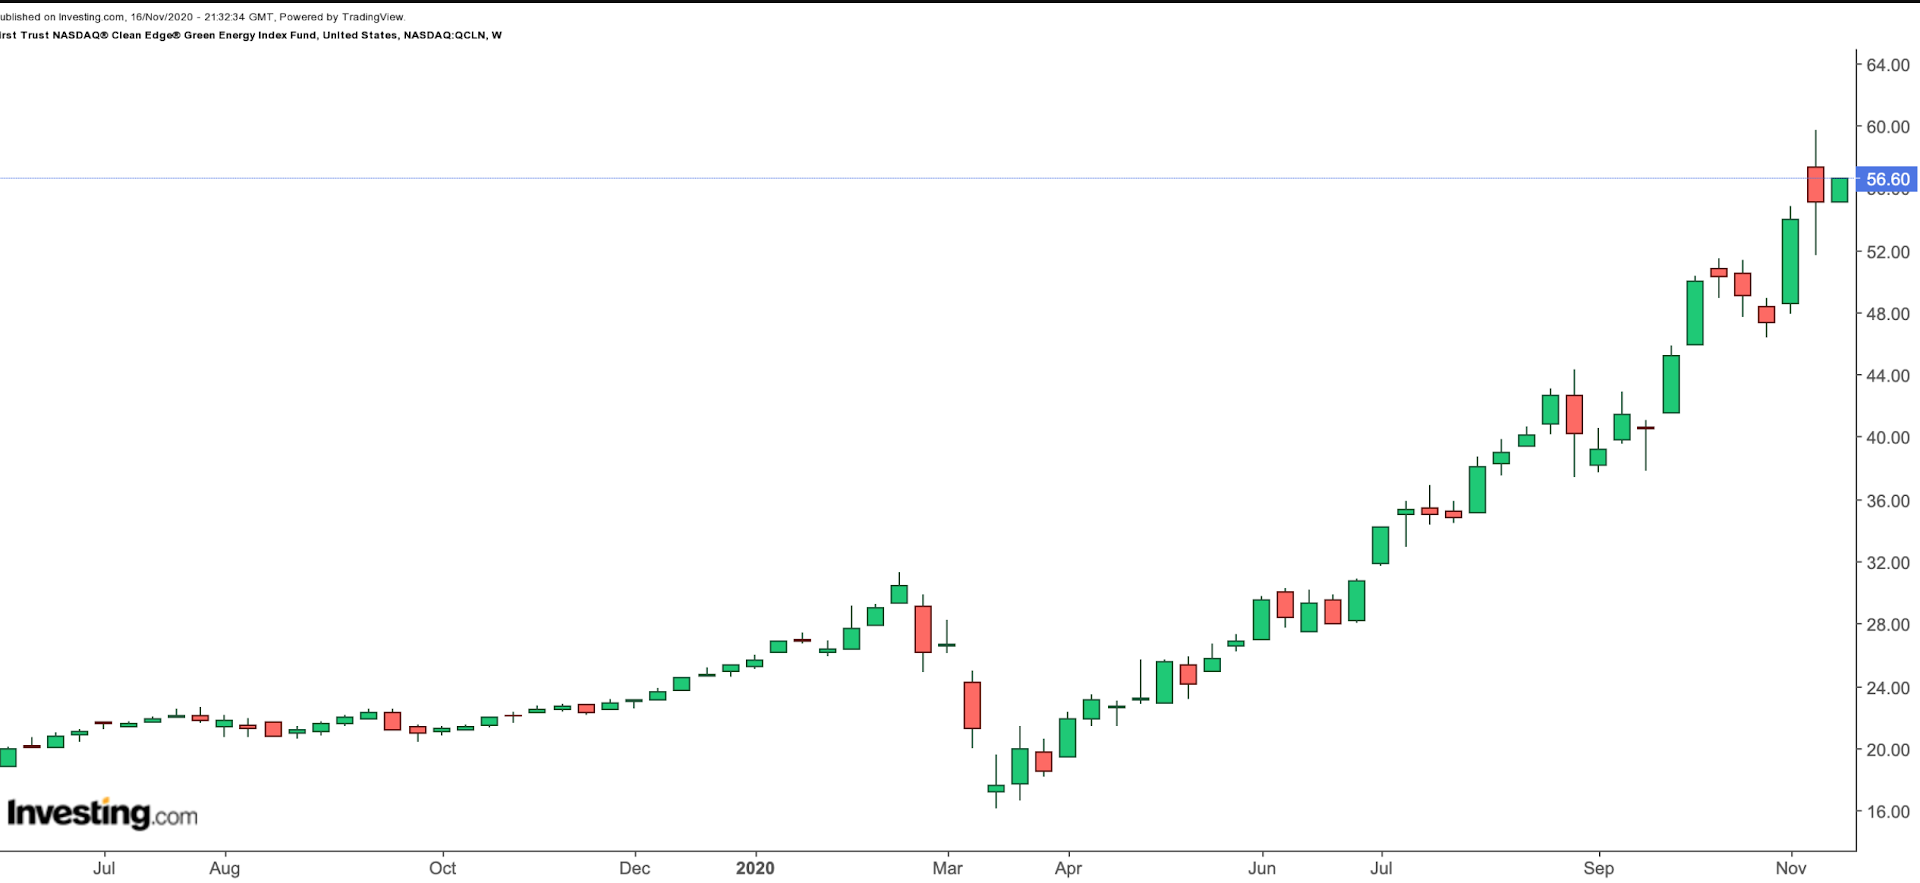
The First Trust NASDAQ Clean Edge Green Energy Index Fund (NASDAQ:QCLN) provides access to a range of companies playing a role in the emerging clean-energy technologies such as solar PV, biofuels or advanced batteries. The fund started trading in 2007.

QCLN, which has 44 holdings, tracks the NASDAQ Clean Edge Green Energy index. The top ten firms constitute over 45% of net assets of almost $1.1 billion.
China-based electric vehicle (EV) group NIO (NYSE:NIO), touted as that country's Tesla (NASDAQ:TSLA), residential energy solutions Enphase Energy (NASDAQ:ENPH), smart energy technology provider Solaredge Technologies (NASDAQ:SEDG), and Albemarle (NYSE:ALB), the largest producer of lithium for EV batteries, are the leading names in the QCLN.
Since the start of the year, QCLN is up over 125% and hit an all-time high of $59.75 on Nov. 9, so $1,000 invested in the fund in early January would now be worth over $2,250. Because of the impressive run-up in price, especially in the past few weeks, short-term profit-taking is likely in many companies within the fund. A potential decline toward $50 would improve the margin of safety.
As far as sectors are concerned, funds are distributed among Renewable Energy Equipment (24.85%), Automobiles (19.50%), Alternative Electricity (15.37%), and Semiconductors (11.38%), among others.
2. SPDR S&P Kensho Clean Power ETF
- Current price: $85.89
- 52-week range: $30.60 - $90.27
- Dividend yield: 0.97%
- Expense ratio: 0.45%
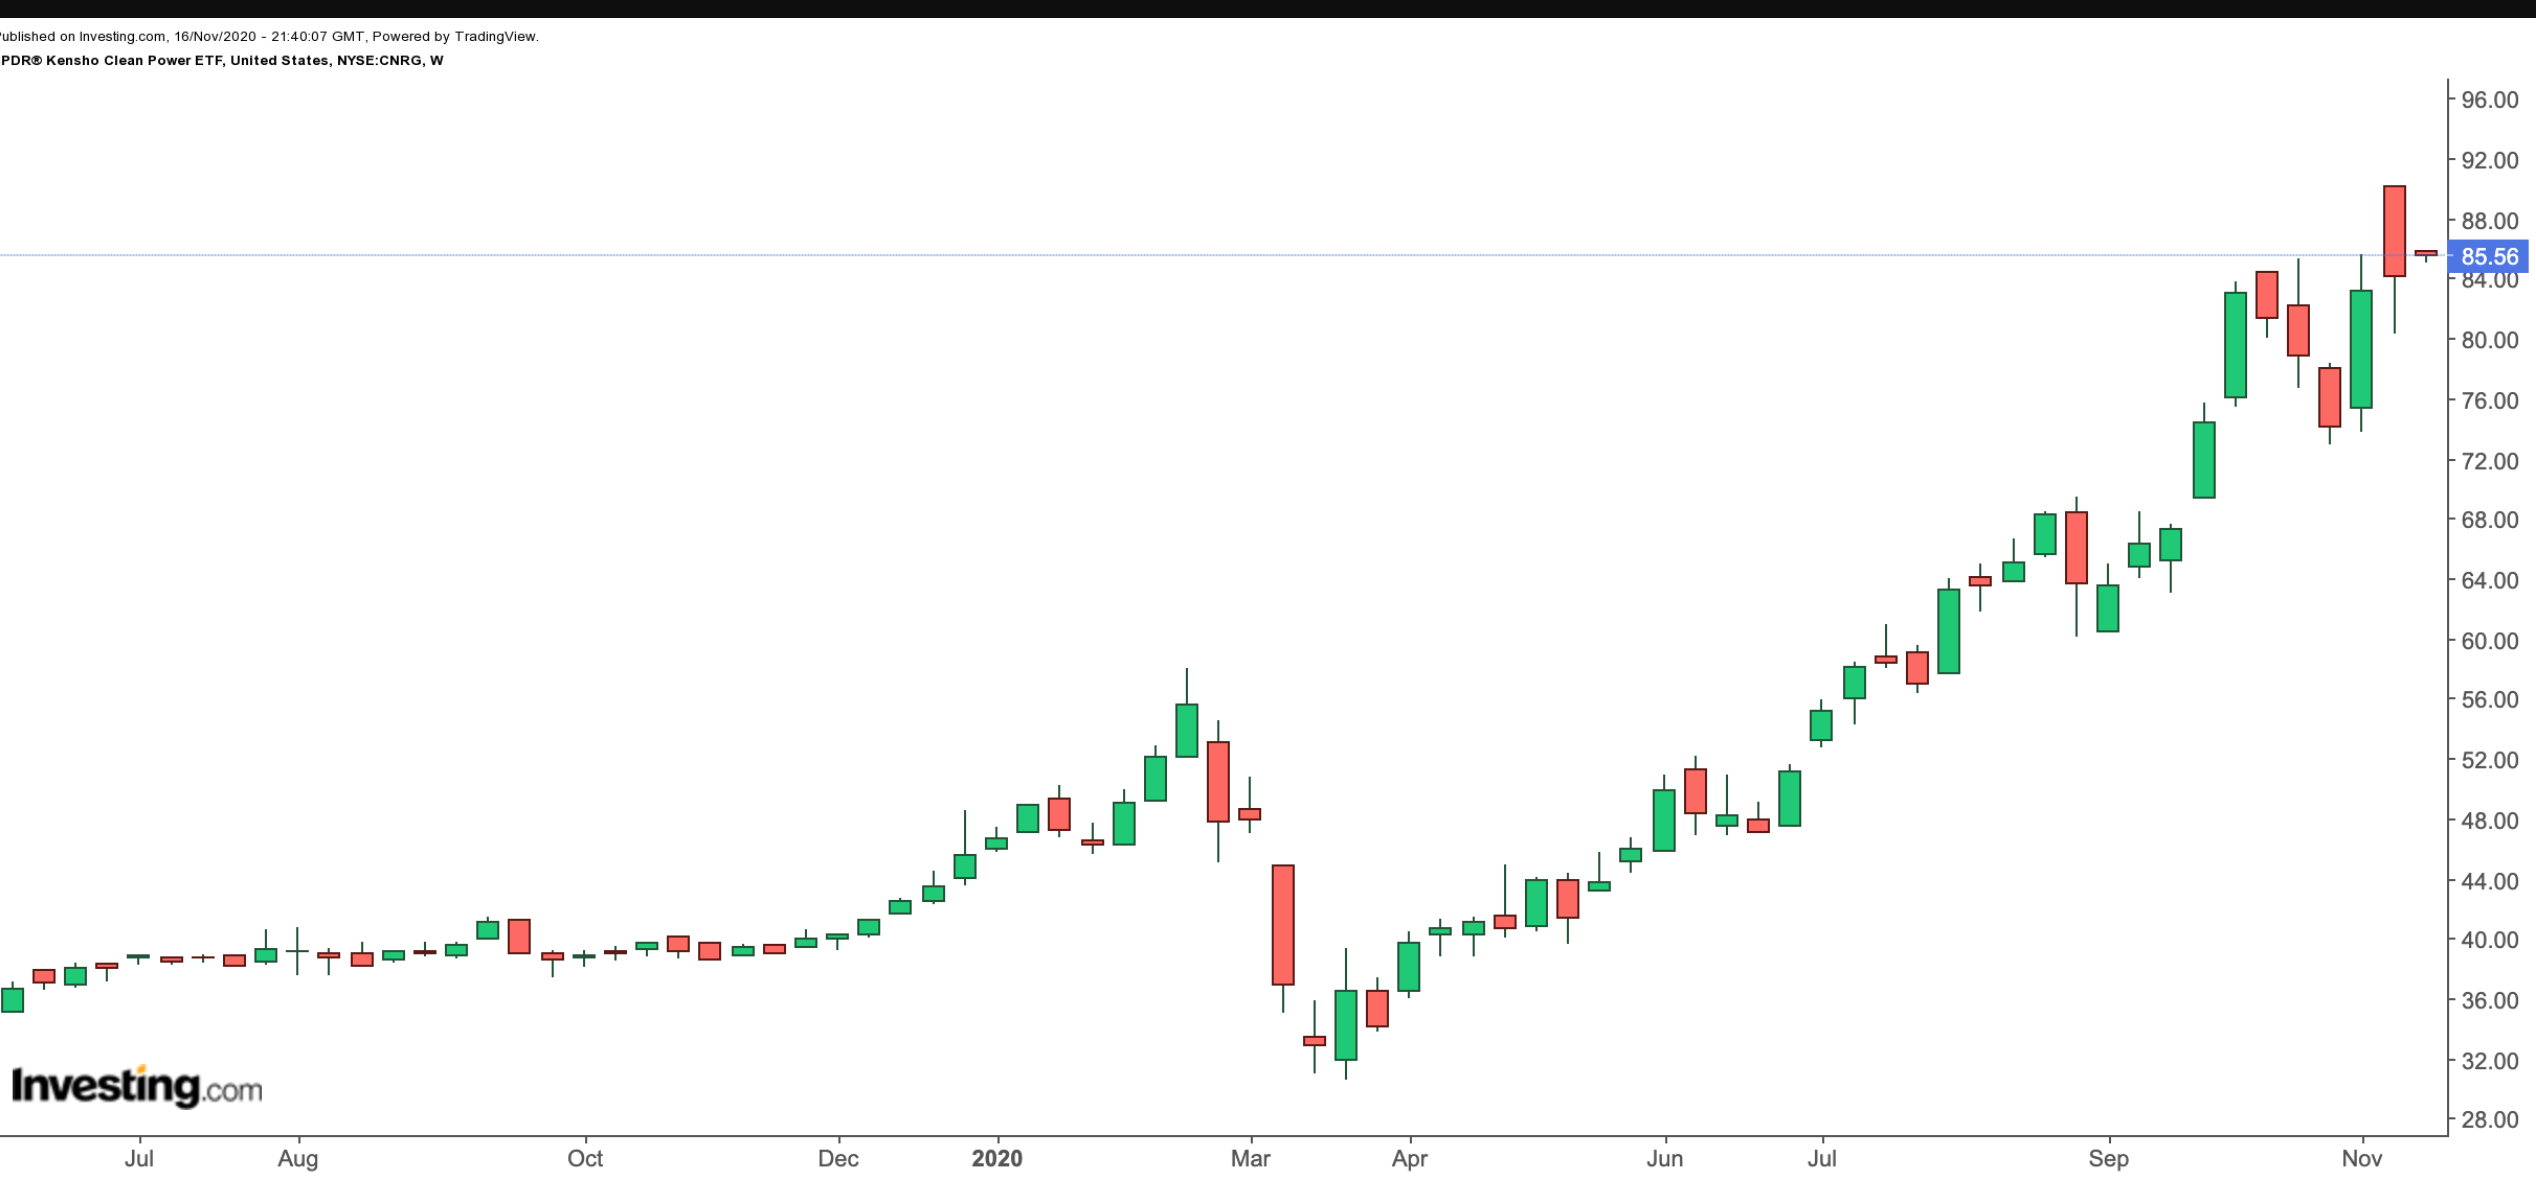
SPDR S&P Kensho Clean Power ETF (NYSE:CNRG), offers access to innovative global businesses that are the driving force behind renewable energy. The ETF was set up in 2018 and currently has over $100 million in net assets.

CNRG has 39 holdings and tracks the S&P Kensho Clean Power Index. Over half of the assets are in the top ten firms.
Home solar panel and battery storage company Sunrun (NASDAQ:RUN), hydrogen fuel cell solutions Plug Power (NASDAQ:PLUG), China-based high-purity polysilicon manufacturer Daqo New Energy (NYSE:DQ), China-headquartered solar panel manufacturer JinkoSolar (NYSE:JKS), and solar solutions SunPower (NASDAQ:SPWR) lead the fund.
The ETF hit an all-time high of $90.27 on Nov. 9 and is currently up over 85% year-to-date. Buy-and-hold investors may find better value in the case of a decline toward $80.
Bottom Line
Clean energy stocks as well as ETFs are making headlines for their growth potential, yet all investment comes with risk. Therefore, proper due diligence is key to maximizing returns.
For long-term investment horizons, we like the sector and both funds, which provide diversification across companies globally. However, given the recent run-up in price, a pullback in the renewable energy stocks as well as these funds would make them more attractive.
