Digitalization is having a substantial impact on the financial services industry. Therefore, financial technology (fintech) has been one of the most important investment themes of recent years.
Research by Thomas Philippon of the New York University Stern School of Business highlights:
“FinTech covers digital innovations and technology-enabled business model innovations in the financial sector. Such innovations can disrupt existing industry structures and blur industry boundaries.. Examples of innovations that are central to FinTech today include cryptocurrencies and the blockchain, new digital advisory and trading systems, artificial intelligence and machine learning, peer-to-peer lending, equity crowdfunding and mobile payment systems.”
Both small start-ups and large established institutions, such as banks, insurance companies or asset managers, are fast becoming part of the fintech revolution.
Put another way, fintech investment is on the rise. For instance, recent metrics suggest that over a third of US personal loans are granted by fintechs. Similarly, “In 2009, fintech startups received $1.1 billion from venture capital investors. In 2020, the investment total reached $44.1 billion.”
Therefore, today’s article introduces two exchange-traded funds (ETFs) that could appeal to a range of readers who want to add thematic fintech funds to their long-term growth portfolios.
1. Global X FinTech ETF
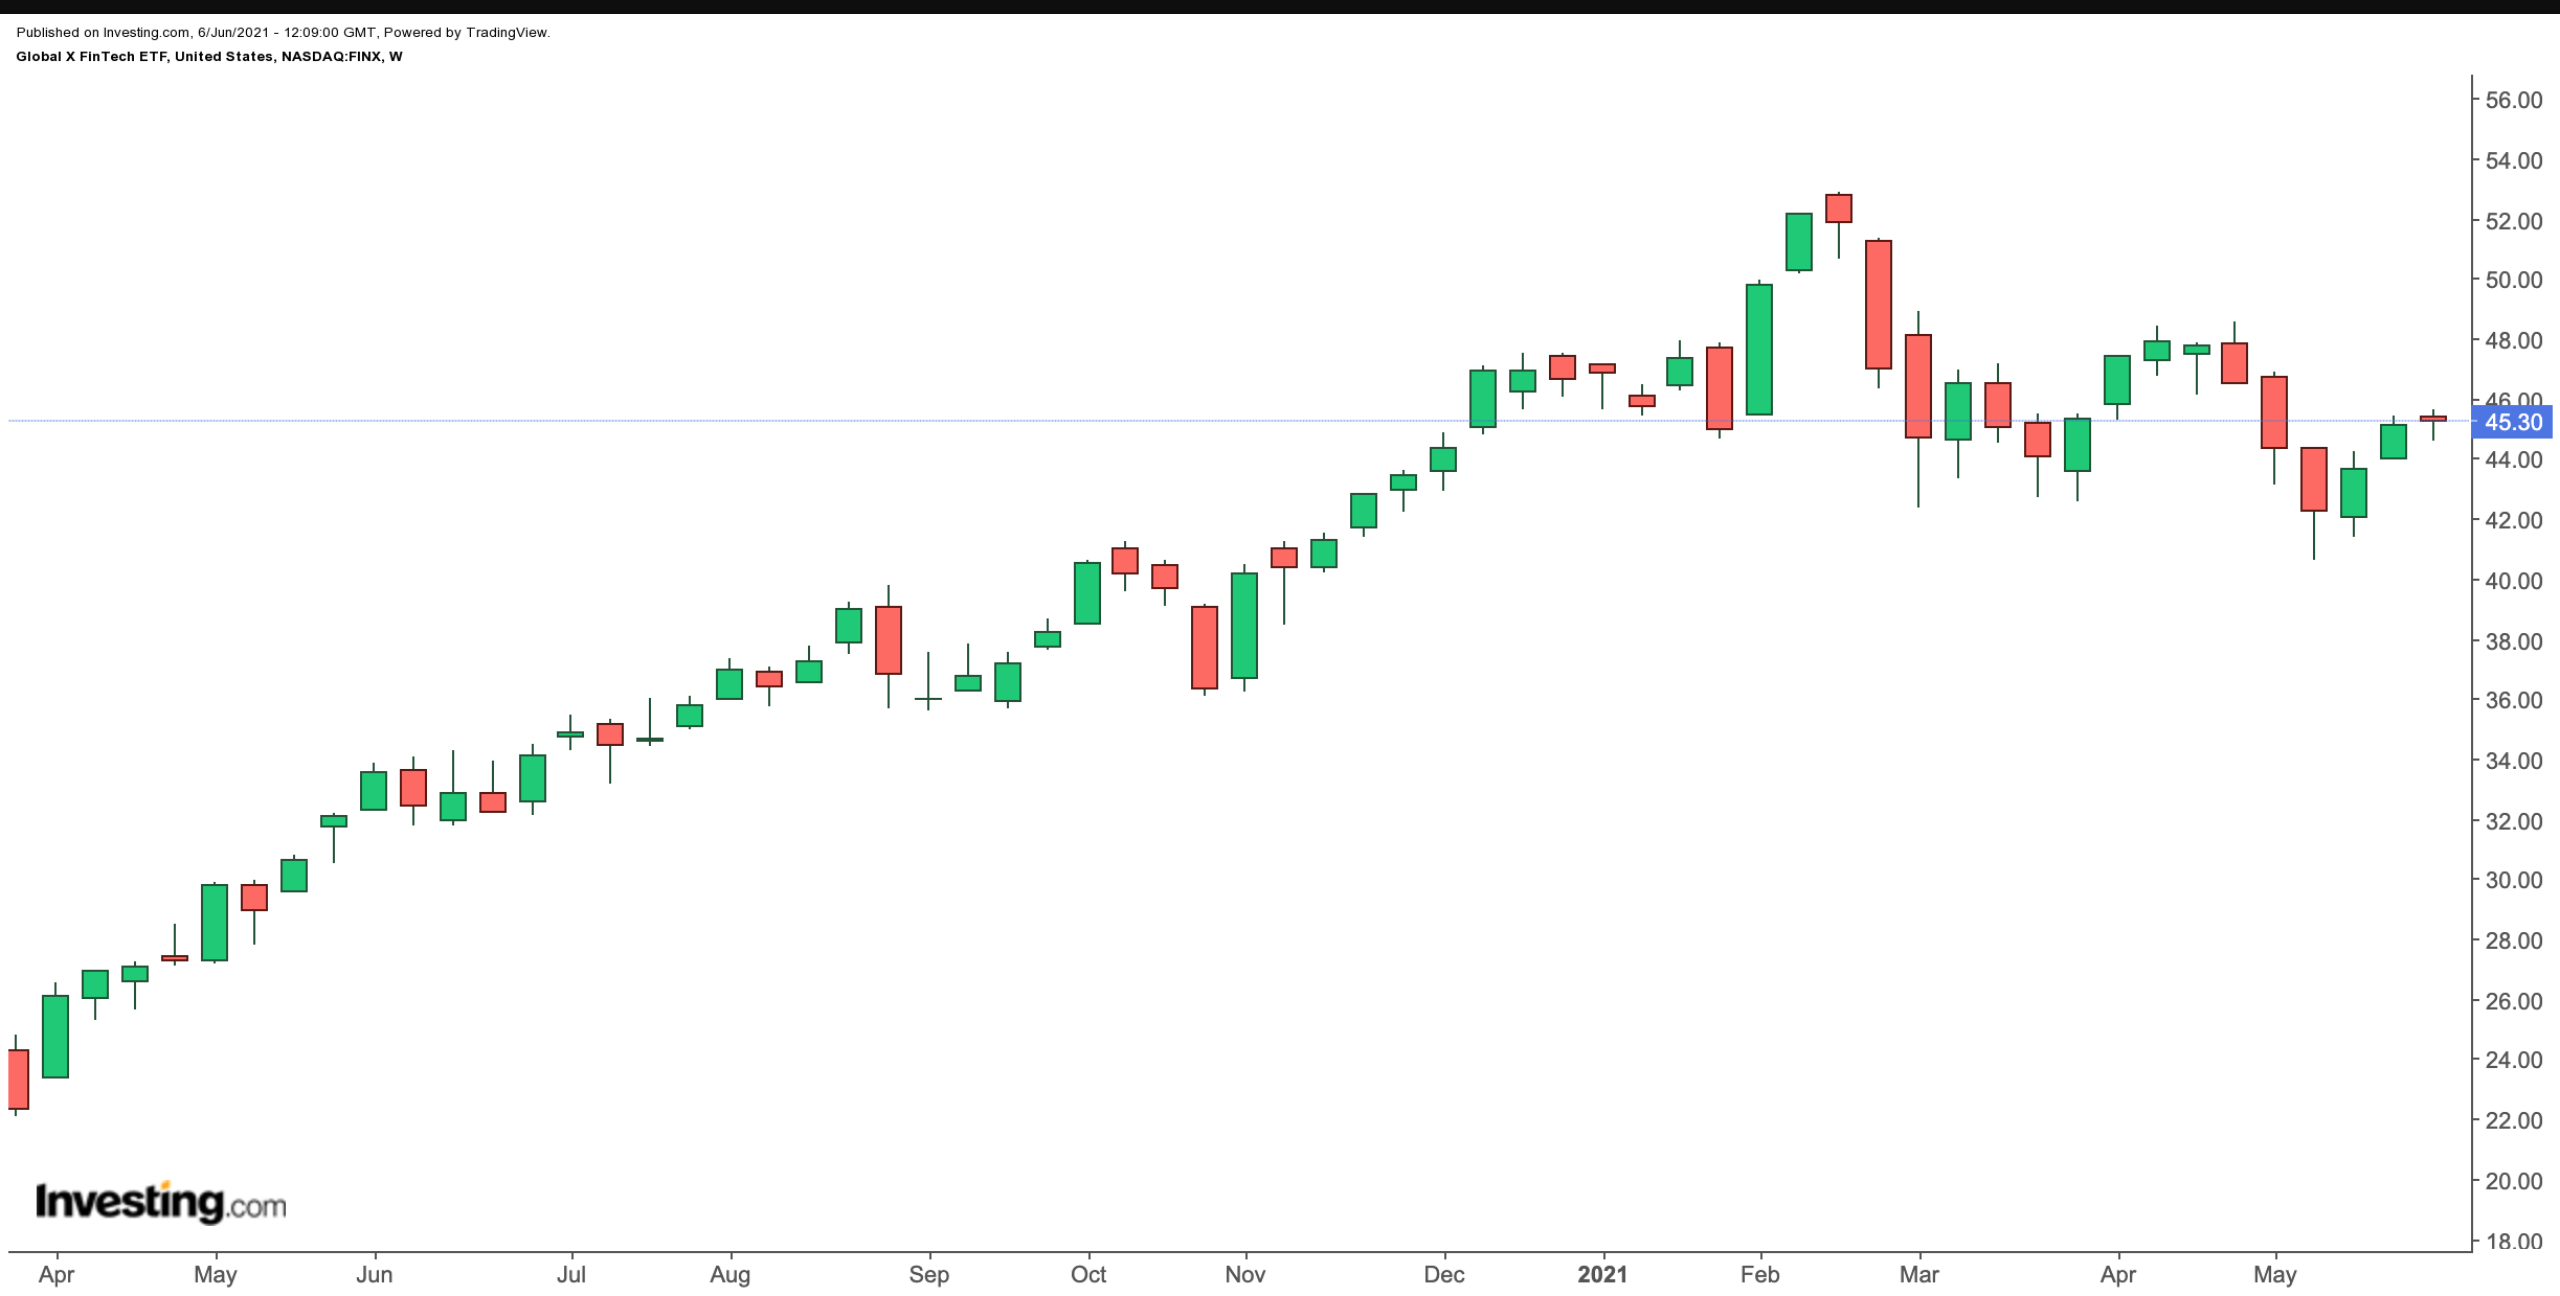
- Current Price: $45.30
- 52-Week Range: $31.75 - $52.87
- Expense Ratio: 0.68% per year
The Global X FinTech ETF (NASDAQ:FINX) provides exposure to companies in the fintech segment. Such businesses typically offer mobile and digital solutions in digital payments, insurance, investing, fundraising, and third-party lending. The fund started trading in September 2016.

FINX, which tracks the Indxx Global FinTech Thematic Index, currently has 39 stocks. Sector allocation of the exchange-traded fund (by weighting) is as follows: Information Technology (82.1%), Financials (9.2%), Industrials (4.7%) and Communication Services (4%).
Looking at country breakdown, the US tops the list with 55.4%, followed by Brazil (8.5%), Australia (7.5%), Netherlands (6.4%) and New Zealand (4.9%).
The top ten holdings comprise around 55% of total net assets of $1.21 billion. Among the leading holdings in the ETF are payments ecosystem company, Square (NYSE:SQ); business and financial management software developer, Intuit (NASDAQ:INTU); Netherlands-based Adyen (OTC:ADYEY) which provides mobile, online and point-of-sale (POS) payment solutions, and digital payments platform, PayPal (NASDAQ:PYPL).
Although the fund is down about 3% year-to-date (YTD), the return in the past 52 weeks is more than 36%. Since seeing a record high in mid-February, the names in FINX have come under pressure. Interested long-term investors could regard this decline as an opportunity to buy the fund.
2. Siren NASDAQ NexGen Economy ETF
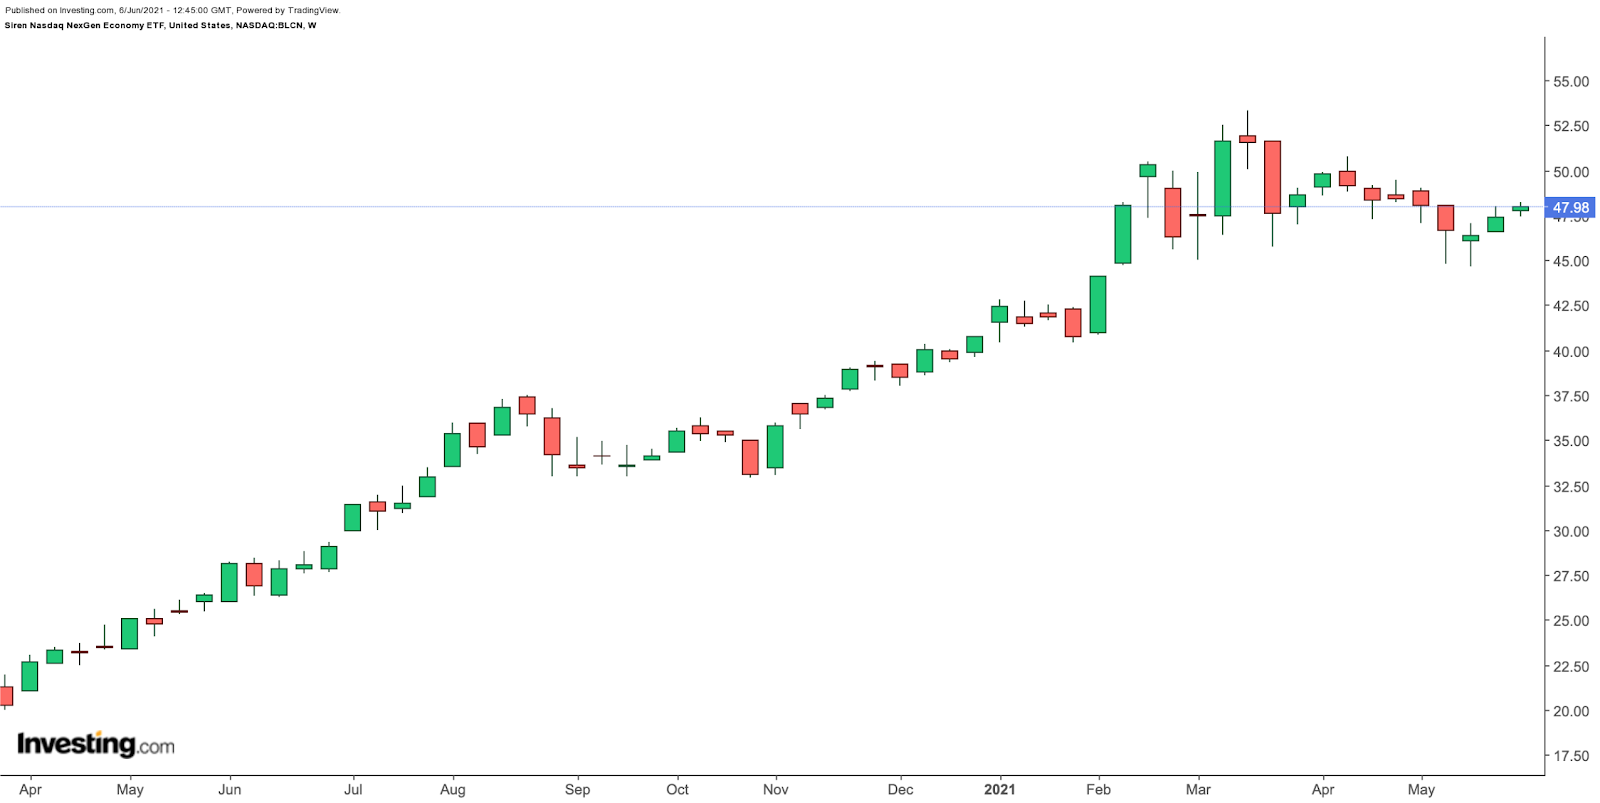
- Current Price: $47.98
- 52-Week Range: $26.28 - $53.31
- Dividend Yield: 0.57%
- Expense Ratio: 0.68% per year
Our next fund, the Siren NASDAQ NexGen Economy ETF (NASDAQ:BLCN) provides exposure to companies that are engaged in developing or using blockchain technologies. International Business Machines (NYSE:IBM) describes blockchain as “a shared, immutable ledger for recording transactions, tracking assets and building trust.”

Most investors know blockchain as the technology behind many cryptocurrencies, such as Bitcoin or Ethereum. Therefore, given the interest in digital currencies, businesses that invest or work with blockchain technologies, also get significant attention.
Metrics by MarketsandMarket point out:
“The global blockchain market size is expected to grow from USD 3.0 billion in 2020 to USD 39.7 billion by 2025, at an impressive Compound Annual Growth Rate (CAGR) of 67.3% during 2020–2025.”
BLCN, which tracks the NASDAQ Blockchain Economy Index, has 75 stocks. The fund began trading in January 2018. More than half of the companies in the ETF come from the US. Next in line are firms based in China (13.23%), followed by Japan (12.18%), Germany (4.13%) and Canada (2.27%).
The top sectors include Technology (41.33%), Financials (35.80%) and Communications (10.92%); and the leading 10 names' holdings comprise over 17% of BLCN's net assets, which stand around $315 million.
Online retailer company, Overstock.com (NASDAQ:OSTK), technology giant International Business Machines, Germany-based enterprise application software provider, SAP (NYSE:SAP), chip darling, NVIDIA (NASDAQ:NVDA), and Japan-based IT products manufacturer, Fujitsu (OTC:FJTSY) top the list of current holdings.
Year-to-date, BLCN is up about 17.74% and saw a record high in mid-March. Over the past 52 weeks, the fund has returned over 72%. Buy-and-hold investors who believe in the future of the distributed ledger technology and the role it could increasingly play in economic transactions, may consider investing around $45.
