Following recent weak results and forecasts from leading retailers, including Walmart (NYSE:WMT), Target (NYSE:TGT), and Lowe’s (NYSE:LOW), Wall Street has deepened its rout. As a result, the Dow Jones Industrial Average posted its biggest one-day loss yesterday since 2020.
Economists have been pricing the likelihood of a US economic recession for a few months now. In such an environment, cyclical companies tend to fall out of favor as they rely on a growing economy to thrive.
Even before yesterday's sell-off in retailers and broader markets, traders have been questioning the strength of general US consumption. As a result, Consumer Discretionary, which essentially comprises the cyclical industry, has become the top shorted sector in April, followed by Healthcare and Energy stocks, according to S&P Global Market Intelligence.
However, on the other side of the equation, April retail and food sales went up by 0.9% from March. This solid increase shows that the US consumer is still strong despite the persistent inflation.
While many cyclical stocks have experienced weakness amid growing macro headwinds, such declines also bring long-term buying opportunities for contrarian investors that seek opportunities among the carnage. Here are two cyclical exchange-traded funds (ETFs) that could benefit from improved sentiment in the second half of the year.
1. Invesco S&P SmallCap Consumer Discretionary ETF
- Current Price: $82.20
- 52-week range: $81.79 - $126.08
- Dividend yield: 0.95%
- Expense ratio: 0.29% per year
The consumer discretionary sector covers goods and services that people typically buy when they have extra cash available, such as cars, white goods, furniture, and entertainment spending.
The first fund on today's list is the Invesco S&P SmallCap Consumer Discretionary ETF (NASDAQ:PSCD). It offers access to US companies from the consumer-cyclical segment of the S&P SmallCap 600. The fund was first listed in April 2010.
PSCD tracks the S&P SmallCap 600 Capped Consumer Discretionary Index and currently holds 89 stocks. In terms of sectoral allocations, we see specialty retail (35%), household durables (20.6%), hotels, restaurants & leisure (13%), auto components (10.7%), and textiles, apparel & luxury goods (9.9%) among others.
The top 10 stocks comprise close to a third of net assets of $28.0 million. In other words, it is a relatively small fund.
Among the leading holdings are the automotive retailer Asbury Automotive Group (NYSE:ABG); sporting goods and outdoor recreation company Academy Sports Outdoors (NASDAQ:ASO); diamond jeweler Signet Jewelers (NYSE:SIG); vehicle retailer Group 1 Automotive (NYSE:GPI); and real estate developer Meritage Homes (NYSE:MTH).
PSCD is down 30.3% since January and 26% over the past 12 months. On June 8, 2021, it hit a record high but is currently trading around a 52-week low.
Trailing price-to-earnings (P/E) and price-to-book (P/B) ratios stand at 8.43x and 2.36x. Investors seeking returns from potentially higher discretionary spending levels in the summer months may want to keep PSCD on their radar screen.
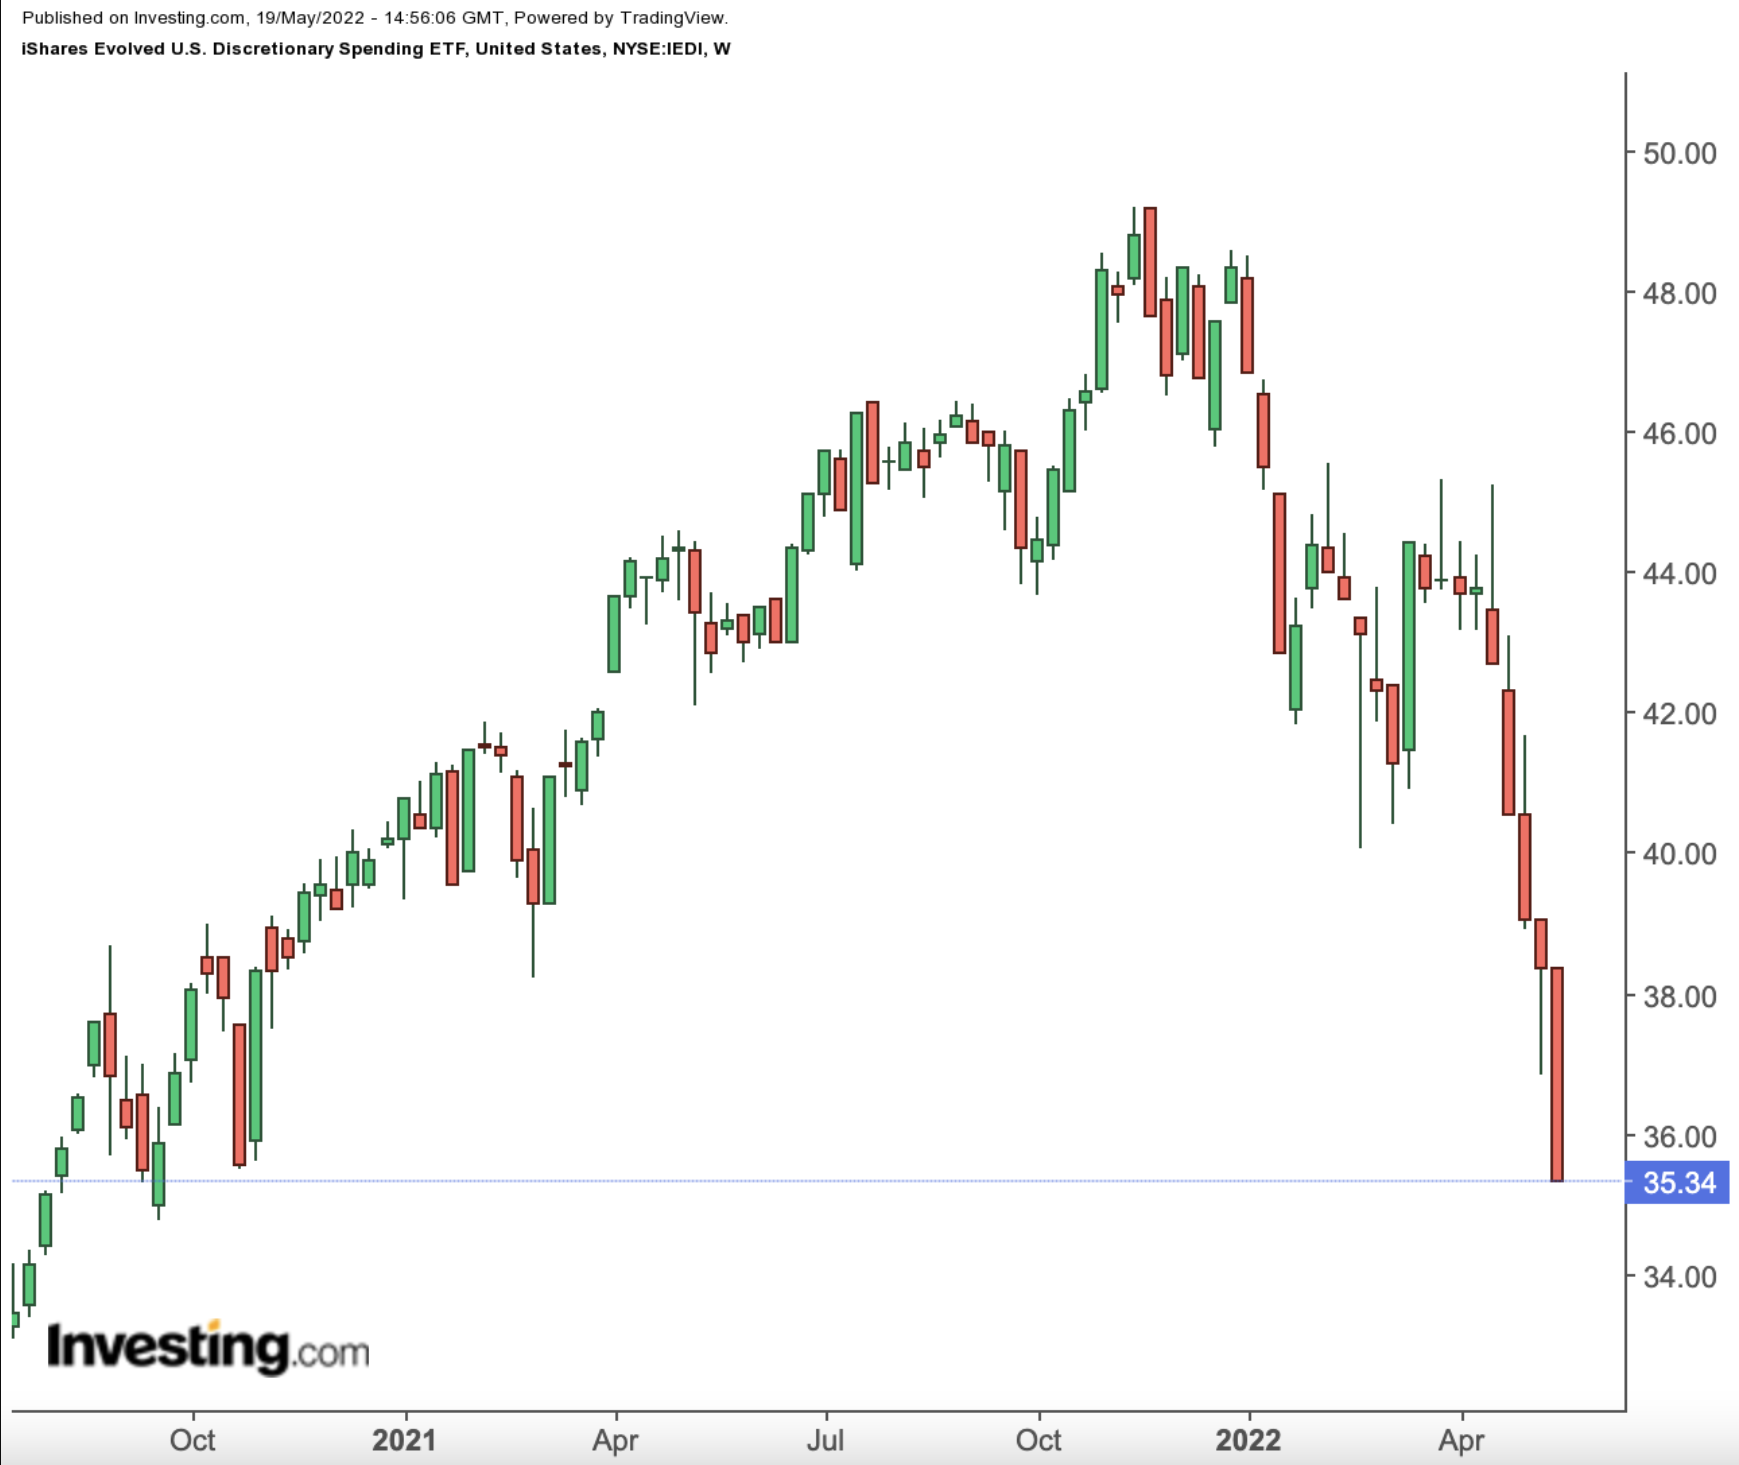
2. iShares Evolved US Discretionary Spending ETF
- Current Price: $35.34
- 52-week range: $35.49 - $49.19
- Dividend yield: 0.89%
- Expense ratio: 0.18% per year
Recent metrics from McKinsey suggest:
"US consumers had approximately $2.8 trillion more in savings than they had in 2019, and many didn't hesitate to dip into those savings as pandemic restrictions eased across the country."
If this trend in consumer spending continues, we can expect discretionary spending levels to stay strong as well.
Next up on our list of funds is the iShares Evolved US Discretionary Spending ETF (NYSE:IEDI), an actively managed fund that provides exposure to US companies in the discretionary spending sector.

IEDI, which currently 218 stocks, started trading in March 2018. The top 10 shares account for over 55% of net assets of $16.0 million. Put another way; it is a small and concentrated fund.
Around half of the portfolio comes from the retailing segment. Next are businesses from the food & staples retailing (16.7%), consumer services (14.4%), and consumer durables (8.6%).
Amazon.com (NASDAQ:AMZN); Home Depot (NYSE:HD); Costco Wholesale (NASDAQ:COST); Walmart; Nike (NYSE:NKE); Target, Lowe’s, and McDonald's (NYSE:MCD) lead the names on the roster.
Readers will note that a number of these companies have been in the news in recent days. Investors have, for example, raised eyebrows at numbers and forecasts by Walmart, Target, and Lowe's. On the other hand, Home Depot has raised its full-year outlook. Meanwhile, McDonald's has announced that it would sell its Russian business.
In November 2021, IEDI hit a record high, shy of $50. But now, it is trading at its 52-week low. As we write, it is down over 26.5% year-to-date and 18.9% in the past 12 months.
Trailing P/E and P/B ratios are 22.46x and 6.09x. A potential decline toward $36.5 could provide a better entry-level for readers who expect discretionary spending by the US consumer to pick up in the coming months.
