As I have written before, it’s important during a stock market correction not to get influenced by sensational articles in the news media about market crashes and comparisons to past market slumps going all the way back to the 1920s which are after all, basically irrelevant. The only thing that really concerns investors now is what will happen to the Australia stock market going forward, and the most likely outcome is that over the longer term it will trend upwards.
I appreciate that in the midst of a market slump that plenty of people will refer to a certain stock that has crashed xx% or point out that the ASX 200 is down almost a 800 points from the 2015 high. But the fact remains that since 1988 the Australian stock market has edged upwards and that generally speaking the return, including dividends, has been around 10% (plus or minus a few %) annually.
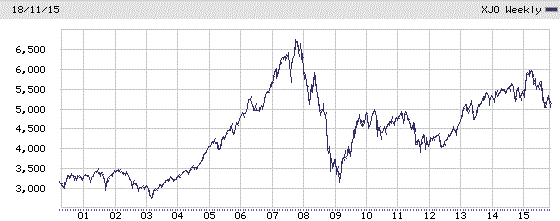
Australian S&P/ASX 200 Index Chart: 1988 – 2015

During market corrections the charts usually doing the rounds are the ones that show the trend downwards and these are often focused on a period of months, not years. Yes these charts are interesting and show us what has happened and we may be able to use them to estimate an emerging trend, but it’s more important in my view to step back and also look at the long term trends.
Looking at the long term chart of the ASX 200 above we can see that the current market pull-back is not even close to being as severe as the one during the GFC in 2007-2008 and in the overall scheme of things, it’s just another correction. Without too much effort we can spot a fall of around 500 points in 2010, a fall of around 1000 points in 2011 and corrections to varying degrees in every year since.
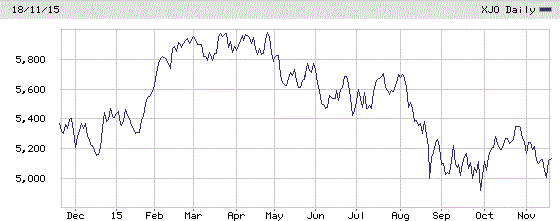
Of course the shorter term view of the ASX 200 is a bit more sobering; So far, 2015 has not been a good year. Maybe the ASX 200 will edge back up towards 6000 again, but if it finishes above where it started the year then that would be a good outcome.
Australian S&P/ASX 200 Index 1 Year Chart

Along with every correction, many who were talking up the market (and this year some were about the break out the “6000 points” champagne) quickly switch to being ultra-bears. They may call what they write “analysis” – but in reality it’s just content for which the mainstream finance media has an insatiable appetite.
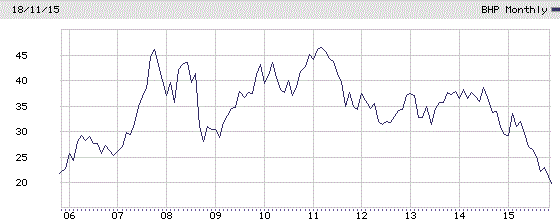
At the moment, the ASX 200 is down around 800 points from the earlier high this year and has been down around 1000 points. For sure it’s a nasty fall, but taking into account the slowdown in the Chinese economy, did we expect anything different? For me the only real surprise is how far a stock like BHP Billiton (AX:BHP) has fallen. Some of this, however, is due to a one-off event (i.e. the dam failure in Brazil).
Having said that, I’m still positive over the long term regarding BHP shares, but it’s probably going to take a few years before my contrarian view will yield good results. For now however, BHP is a classic example of what happens when a blue chip stock falls out of favour with investors, analysts and the media.
BHP Billiton 10 Year Stock Price Chart

Basically, the entire mining boom phase has been priced out of BHP stock price. This price correction is probably a touch over-done now in my opinion, but at this stage BHP is a risky buy at best and certainly there’s been a lot of action on the sell side recently.
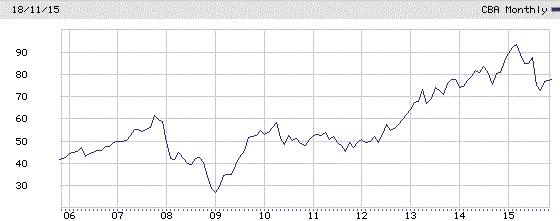
On the other hand a stock like the Commonwealth Bank (AX:CBA) has actually had a very good run since being sold-off heavily during the GFC, as shown by the chart below.
Commonwealth Bank 10 Year Stock Price Chart

Recently, CBA shares have also fallen back from the high they reached earlier this year so it’s not just the mining stocks that have been sold-off, although the ASX-listed, financial-related stocks have—generally speaking—held up better than stocks in the resources sector.
So it’s not all gloom and doom out there at the moment, although in terms of stocks we are certainly in a rough patch. However, from a long term perspective the overall upwards trend for the ASX 200 is still holding despite the recent correction.
Finally let me finish with a quote from one of the great investors, Peter Lynch:
“You get recessions, you have stock market declines. If you don’t understand that’s going to happen, then you’re not ready, you won’t do well in the markets.”
Exactly.
