- All Instrument Types
- Indices
- Equities
- ETFs
- Funds
- Commodities
- Currencies
- Crypto
- Bonds
- Certificates
Please try another search

Chart Of The Day: Netflix Could Be Topping

Even though Netflix (NASDAQ:NFLX) has almost 200 million viewers worldwide, rather than rest on its laurels, the streaming entertainment giant continues to relentlessly push to increase its market share.
This laser focus on growing its user base is a significant reason that, despite having been eulogized many times because of its negative cashflow, the stock continues to rise. Still, because of its practice of burning through billions of dollars every year to create fresh content, and with a debt load of $14 million, momentum isn't always steady.
Since June 2018, shares of Netflix have been bouncing between bears and bulls, with the $400 level appearing to be out of reach. That is, until February.
But in March, the stock was pressured by the broader coronavirus panic selloff, reaching $290 at the lows. From that point forward though, Netflix climbed along with the rest of the market.
But having been deemed by many investors to be the perfect COVID-19 lockdown stock—a very affordable way to be entertained while sheltering in place when cinemas, clubs and shops were all shuttered—unlike many other equities, by May 18 Netflix had hit new all-time highs, cutting through the previous $400 resistance in the process.
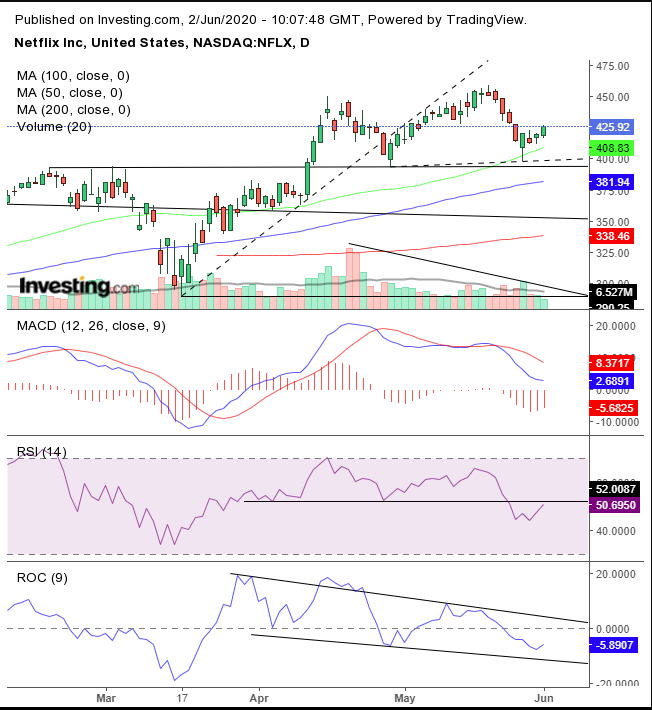
Though for many, Netflix has already proved itself despite its questionably high level of debt and the chance that some of its subscribers will evaporate once lockdowns end, right now the stock looks to be headed lower based on shifts in supply and demand.
The stock’s all-time high was just 2% higher than its April 16 intraday peak. Previous gains between the peaks were 55.8% between Sept. 24, 2019 and Feb. 19, 2020, but just 14.4% between Feb. 19 and April 16. Clearly, momentum is slowing.
As well, note that the May 27 low is just 1.1% above the April 29 low, retracing almost the entire move off its recent peak, adding to technical signals that the uptrend is in question.
This weakening pattern has all the telltale signs of a H&S top:
- The small advance of the head
- The loss is seen in the previous move
- Diminishing volume in contrast to the rising price
- Both the RSI and ROC providing negative momentum divergences, as well
- A MACD reversal, clarifying that price is weakening over multiple gauges
The pattern will be complete when a decisive fall below the $390 level occurs. This would demonstrate that traders have realized the price was overvalued when the lockdown put Netflix in a very favorable spotlight. But, with a reopening economy enabling the spread of capital to depreciated assets, conviction was moving elsewhere.
Trading Strategies
Conservative traders would wait for that downside breakout and for the likely return-move to demonstrate that investors had truly changed their minds about the trend.
Moderate traders are likely to be content with a fall below the $400 level, the psychological round number where the trendline drawn between the prior to lows meet. While these traders too would probably wait for the price to provide a corrective rally, they’d do so for the better entry, not necessarily to retest resistance.
Aggressive traders may short the stock as well, if it gets to $450 levels, where the head confirmed the shoulder’s resistance. Should the price decline from there, aggressive traders might join other traders upon a downside breakout of the H&S top.
Trade Sample – Aggressive Short Position Setup
- Entry: $450
- Stop-Loss: $460 – above the May peak
- Risk: $10
- Target: $400 – psychological, round number that meets the presumed level of the neckline
- Reward: $50
- Risk:Reward Ratio: 1:5
Related Articles

New tariffs stoke inflation fears and rattle markets. With recession risks rising, defensive stocks look more appealing. InvestingPro spots three undervalued picks with...

More than a century ago, then-Representative William McKinley pursued an aggressive tariff strategy that sought to protect American industry and reduce reliance on foreign...

The long-run expected total return for the Global Market Index (GMI) fell in February, sliding to an annualized 7.1% vs. the previous month’s 7.4%. The downward revised forecast...
Are you sure you want to block %USER_NAME%?
By doing so, you and %USER_NAME% will not be able to see any of each other's Investing.com's posts.
%USER_NAME% was successfully added to your Block List
Since you’ve just unblocked this person, you must wait 48 hours before renewing the block.
I feel that this comment is:
Thank You!
Your report has been sent to our moderators for review


Add a Comment
We encourage you to use comments to engage with users, share your perspective and ask questions of authors and each other. However, in order to maintain the high level of discourse we’ve all come to value and expect, please keep the following criteria in mind:
Perpetrators of spam or abuse will be deleted from the site and prohibited from future registration at Investing.com’s discretion.