

BALANCE ON GOODS AND SERVICES
- In trend terms, the balance on goods and services was a surplus of $2,259m in November 2018, a decrease of $7m on the surplus in October 2018.
- In seasonally adjusted terms, the balance on goods and services was a surplus of $1,925m in November 2018, a decrease of $88m on the surplus in October 2018.
CREDITS (EXPORTS OF GOODS AND SERVICES)
- In seasonally adjusted terms, goods and services credits rose $532m (1%) to $38,445m. Non-monetary gold rose $681m (60%). Non-rural goods fell $173m (1%) and rural goods fell $34m (1%). Net exports of goods under merchanting remained steady at $37m. Services credits rose $57m (1%).
DEBITS (IMPORTS OF GOODS AND SERVICES)
- In seasonally adjusted terms, goods and services debits rose $620m (2%) to $36,520m. Capital goods rose $433m (7%), consumption goods rose $202m (2%) and non-monetary gold rose $30m (9%). Intermediate and other merchandise goods fell $22m. Services debits fell $22m.
BALANCE ON GOODS AND SERVICES
In trend terms, the balance on goods and services was a surplus of $2,259m in November 2018, a decrease of $7m on the surplus in October 2018.
In seasonally adjusted terms, the balance on goods and services was a surplus of $1,925m in November 2018, a decrease of $88m on the surplus in October 2018.

EXPORTS OF GOODS AND SERVICES
Between October and November 2018, the trend estimate of goods and services credits rose $231m (1%) to $38,198m.
In seasonally adjusted terms, goods and services credits rose $532m (1%) to $38,445m. Non-monetary gold rose $681m (60%). Non-rural goods fell $173m (1%) and rural goods fell $34m (1%). Net exports of goods under merchanting remained steady at $37m. Services credits rose $57m (1%).


RURAL GOODS
In trend terms, exports of rural goods fell $68m (2%) to $3,842m.
In seasonally adjusted terms, exports of rural goods fell $34m (1%) to $3,738m.
The main components contributing to the fall in seasonally adjusted estimates were:
- other rural, down $33m (2%)
- wool and sheepskins, down $30m (8%).
Partly offsetting these falls was meat and meat preparations, up $25m (2%).
NON-RURAL GOODS
In trend terms, exports of non-rural goods rose $323m (1%) to $24,723m.
In seasonally adjusted terms, exports of non-rural goods fell $173m (1%) to $24,754m.
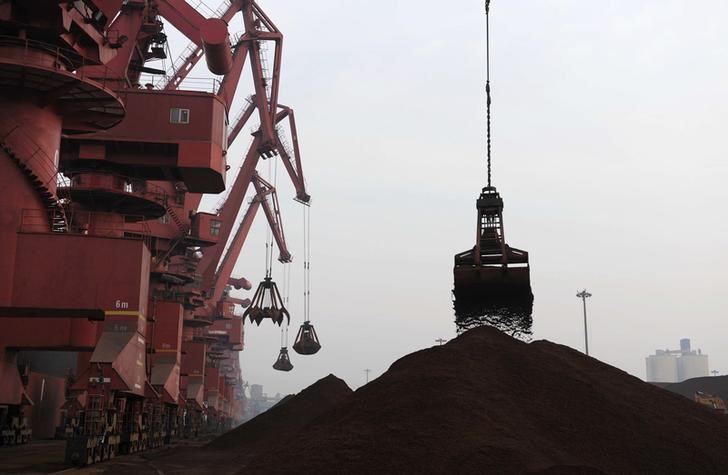
The main component contributing to the fall in seasonally adjusted estimates was coal, coke and briquettes, down $543m (9%).
Partly offsetting this fall were:
- metal ores and minerals, up $317m (4%)
- other mineral fuels, up $90m (2%).
For price and volume details, see the Selected commodities section.
NET EXPORTS OF GOODS UNDER MERCHANTING
In trend terms, net exports of goods under merchanting rose $4m (13%) to $36m.
In seasonally adjusted terms, net exports of goods under merchanting remained steady at $37m.
NON-MONETARY GOLD
In trend terms, exports of non-monetary gold fell $72m (5%) to $1,513m.
In original and seasonally adjusted terms, exports of non-monetary gold rose $681m (60%) to $1,824m.