A look at the day ahead in U.S. and global markets from Mike Dolan.
The big consensus bet of 2023 is already in full swing - bonds are bid.
Although they backed up a bit first thing today, U.S. 10 and 30-year Treasury yields swooned to their lowest since mid-September on Wednesday.
At a low over the past 24 hours of 3.40%, the 30-year long bond yield has now lost a full percentage point since its 2022 peak in October. In price terms, it has gained more than 10% over the past month.
Some may puzzle over why yields have plunged this week ahead another interest rate rise from the U.S. Federal Reserve next week, but 2023 recession fears - justified by the incoming data or not - are taking hold. And with the yield curve between 3-months and 10 years closing at its most inverted in more than 40 years - the bond market itself is screaming a downturn is coming.
Three spurs to the move came on Wednesday. The first was plunge in Brent crude oil prices to the lowest level of year below $77 per barrel on a mix of recession fears, higher inventories and the G7's Russian oil price cap some 30% below prevailing world prices.
With year-on-year oil price gains evaporating to zero, that is dragging inflation expectations down in lockstep.
The second spur was another disinflationary signal from downward revisions to third quarter U.S. labour cost estimates.
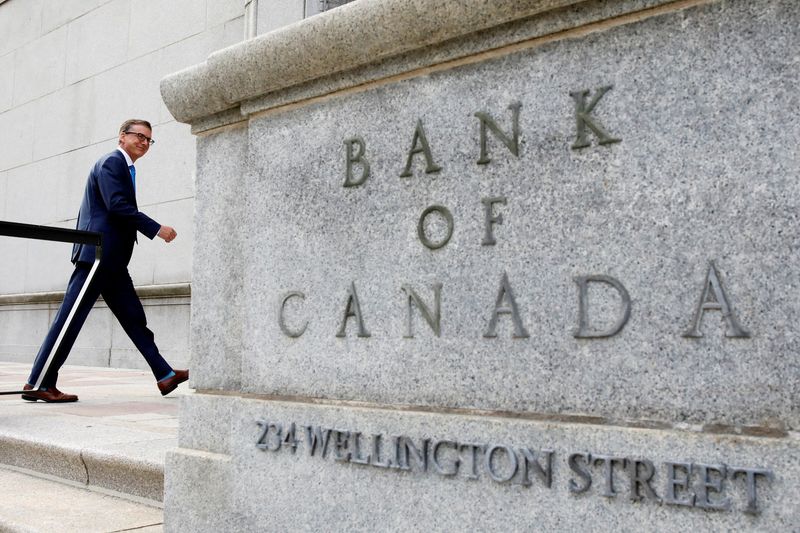
The third came from the Bank of Canada's 'dovish rate hike', where it accompanied another half point rate rise with what many read as a signal it would now pause the tightening campaign. While it might be a stretch, that was seen as possible indicator of the mood in other G7 central banks.
The U.S. Fed's implied terminal rate for next year hovers just under 5% for May, but there's now a half point of rate cuts priced between that the yearend.
And yet for all the ebullience in bonds, it did little to cheer stocks - which investors assume will struggle next year again if a recession does indeed hit. The S&P500 closed in the red for the fourth day and both Wall St futures and most major world bourses remained subdued on Thursday.
The exception was in Hong Kong, which the Hang Seng benchmark has now recouped all this year's underperformance versus world indices and the S&P500. With year-to-date losses of just 16%, that's better that the 18% drop for the S&P and 26% fall for China's mainland indices.
The Hang Seng added another 3% on Thursday as the Hong Kong government loosened its COVID-19 curbs further. The isolation period for patients and contacts will be cut to five days from seven days and requirements for arrivals to Hong Kong to undergo daily tests will similarly be reduced to five days.
Elsehere, Japan upgraded its Q3 growth assessment.
And in global politics, eyes were on Peru. The country swore in a new president on Wednesday after a day of political drama that saw leftist leader Pedro Castillo arrested after his ousting from office in an impeachment trial following his last-ditch bid to cling to power by dissolving Congress.
Key developments that may provide direction to U.S. markets later on Thursday:
* US weekly jobless claims. Mexico Nov inflation
* U.S. corporate earnings: Costco (NASDAQ:COST), Cooper Companies, Broadcom (NASDAQ:AVGO)
* European Central Bank President Christine Lagarde, Bank of Spain´s governor Pablo Hernandez de Cos speak Graphic: Trouble Ahead? https://fingfx.thomsonreuters.com/gfx/mkt/egvbyynybpq/One.PNG Graphic: There and Back Again: A Crude Oil Journey, https://www.reuters.com/graphics/GLOBAL-OIL/xmpjkoaebvr/chart.png Graphic: Productivity and labor costs, https://www.reuters.com/graphics/USA-STOCKS/xmvjkozegpr/prodlaborcosts.png Graphic: Another hike delivered, https://www.reuters.com/graphics/CANADA-CENBANK/klvygkxnxvg/chart.png
(By Mike Dolan, editing by Angus MacSwan mike.dolan@thomsonreuters.com. Twitter: @reutersMikeD)
