The Australian dollar (AUD) and the Canadian dollar (CAD) are called “commodity currencies” for a reason. The reason is that regardless of what’s happening in their associated local economies, on a multi-year basis they will usually trend in the same direction as broad-based commodity indices.
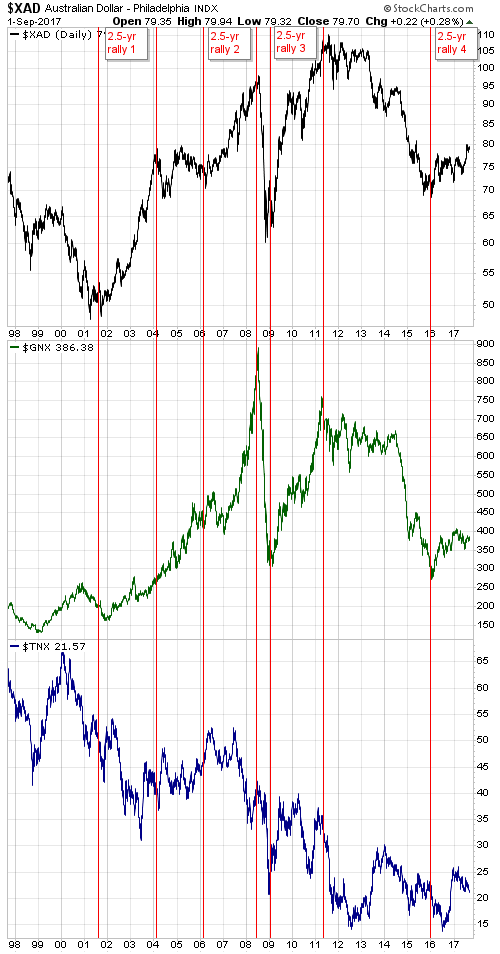
Since 2001 there have been three major rallies in the AUD, each lasting about 2.5 years. These 2.5-year rallies are indicated by vertical red lines and notes on the following chart. Our assumption, which is also indicated on the following chart, is that the fourth 2.5-year AUD rally began in early-2016. In other words, we are guessing that the AUD upward trend that began in early-2016 will continue until around mid-2018. As well as being based on the lengths of previous major upward trends, this guess is based on what we expect from commodity prices.
Speaking of commodity prices, in addition to the AUD the chart shows the GSCI Spot Commodity Index (GNX). Unsurprisingly, each of the 2.5-year AUD rallies indicated on the chart coincided with an upward-trending GNX. In terms of price direction, the main difference between the post-2001 performance of the AUD and the post-2001 performance of GNX is that GNX trended upward from the beginning of 2002 until its blow-off top in mid-2008 whereas the AUD experienced a flat 2-year correction during 2004-2005.
Mainly for interest’s sake (pun intended), the chart also shows the yield on the 10-year T-Note. The 10-year interest rate had a downward bias during two of the AUD’s 2.5-year rallies and an upward bias during the third rally. We expect that it will have an upward bias over the course of the current (fourth) rally.

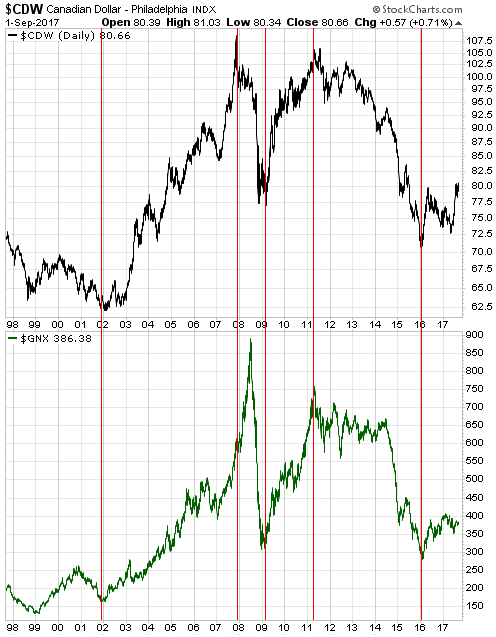
The next chart shows the relationship between the CAD and commodity prices as represented by GNX. If anything, with one notable 6-month exception the positive correlation between the CAD and GNX has been even stronger than the positive correlation between the AUD and GNX. The notable exception occurred during the first half of 2008, when a speculative blow-off move to the upside in the commodity markets was accompanied by a decline in the CAD. This divergence was a warning that the commodity-price gains would prove to be temporary.

We are expecting the upward trends in the commodity indices and the commodity currencies to extend well into next year, although it’s likely that short-term corrections will begin soon.
