For some time now, the market narrative for oil has been that it's poised to go to $100 a barrel and even higher. The assumption for this was based on many factors. But a key driver was considered to be the removal of Iranian supply from the global marketplace, after US President Donald Trump reenacted sanctions against the Middle Eastern country.
However, several other factors weighed on prices instead, including risk-off sentiment and rising US shale production. As well, recent US waivers provided eight countries with exemptions from the sanctions, allowing them to import Iranian oil without penalty for the next 180 days. This occurred even after Iran proudly thumbed it's nose at the US, declaring that it would defy the sanctions and continue to export oil.
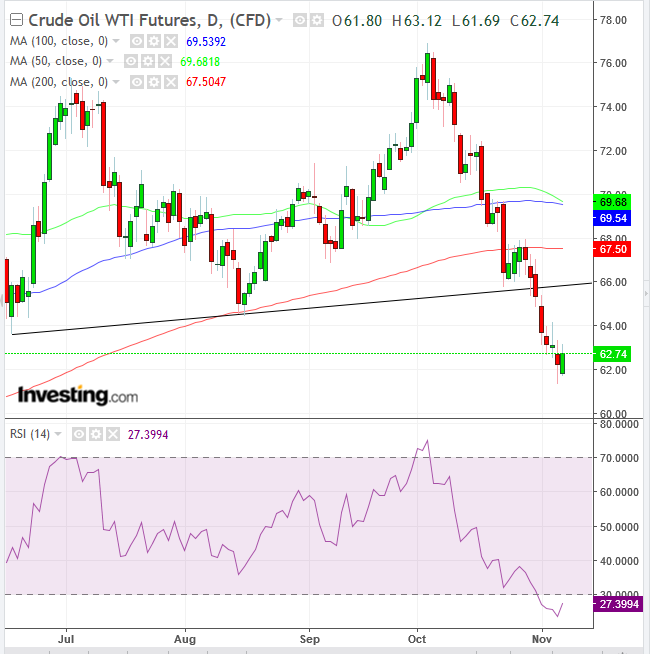
The result: oil prices tumbled, falling for seven straight days. However, in the 90 minutes between 4 to 5:30AM EDT, prices started jumping, with no clear fundamental reason apparent. The only explanation we can come up with is technical.

Other than the obvious 7-day drop which traders would always view as a profit-taking opportunity, the timing might be related to the price closing in on the long-term uptrend line since the February 2016 bottom of $26.05. Yesterday's $61.31 low reached 4.5 percent above the uptrend line, the closest since August 30, 2017.
Also, the RSI reached 23.7, the most oversold condition for the commodity since the aforementioned early-2016 bottom. The proximity to the long-term demand line combined with crude's long-term oversold condition may have prompted profitable traders to cash out.
While the mid-term trend is very much in question, after falling below the $64.51 low hit on August 15, it is still considered to be within the long-term uptrend, as a reversal requires two lower highs as well as troughs. Thus, to be clear, the long-term trend is still unquestionably within an uptrend.
In summary: The midterm trend is up but in question, while the long-term trend is unquestionably up. However, even if the long-term trend would remain intact, traders assume the risk of a deeper correction before the next rally, as yesterday’s price was still 4.5 percent above the uptrend line.
Trading Strategies
Conservative traders would wait for the mid-term to clearly align with the uptrend after posting a price higher than the preceding October 3, $76.90 peak.
Moderate traders may rely on the long-term trend to go long, though they must consider the risk of a deeper correction before the presumed rally. Their choice is to wait for the potential deeper correction, limiting exposure but risking the loss of the trade if prices start to advance; alternatively they can trade now and assume the risk of a further correction.
Trade Sample
- Entry: $62, upon retesting support AFTER a close today above $62.75, yesterday’s real body (open-close price range, ignoring intraday moves)
- Stop-loss: $61, below yesterday’s low
- Risk: $1.00
- Target: $65
- Reward: $3
- Risk-Reward Ratio: 1:3
Aggressive traders may short upon a close above $62.75, but not necessarily wait for a potential better entry.
Trade Sample:
- Entry; $62.75
- Stop-loss $62.00
- Risk: $0.75
- Target: the $70, round number, presumed level of broken short-term uptrend line and 200 DMA
- Reward: $7.25
- Risk-Reward Ratio: 1:10
